

Author
Jonathan Hobbs, CFA
Date
10 Nov 2026
Category
Investor update
IncomeShares Monthly Investor Update – October 2026
Your capital is at risk if you invest. You could lose all your investment. Please see the full risk warning here.

Falling tech stocks and precious metals pulled IncomeShares total assets under management (AUM) down to $208.8 million in October. That was the first monthly fall since we launched in July 2024. Investors still added $10.8 million to IncomeShares exchange-traded products (ETPs), taking cumulative fund flows to $295.1 million. Trading turnover reached $53.5 million – our second-busiest month since launch. Digital asset ETPs again paid the highest distribution yields.
This update breaks down the numbers for the month.
Assets under management (AUM)
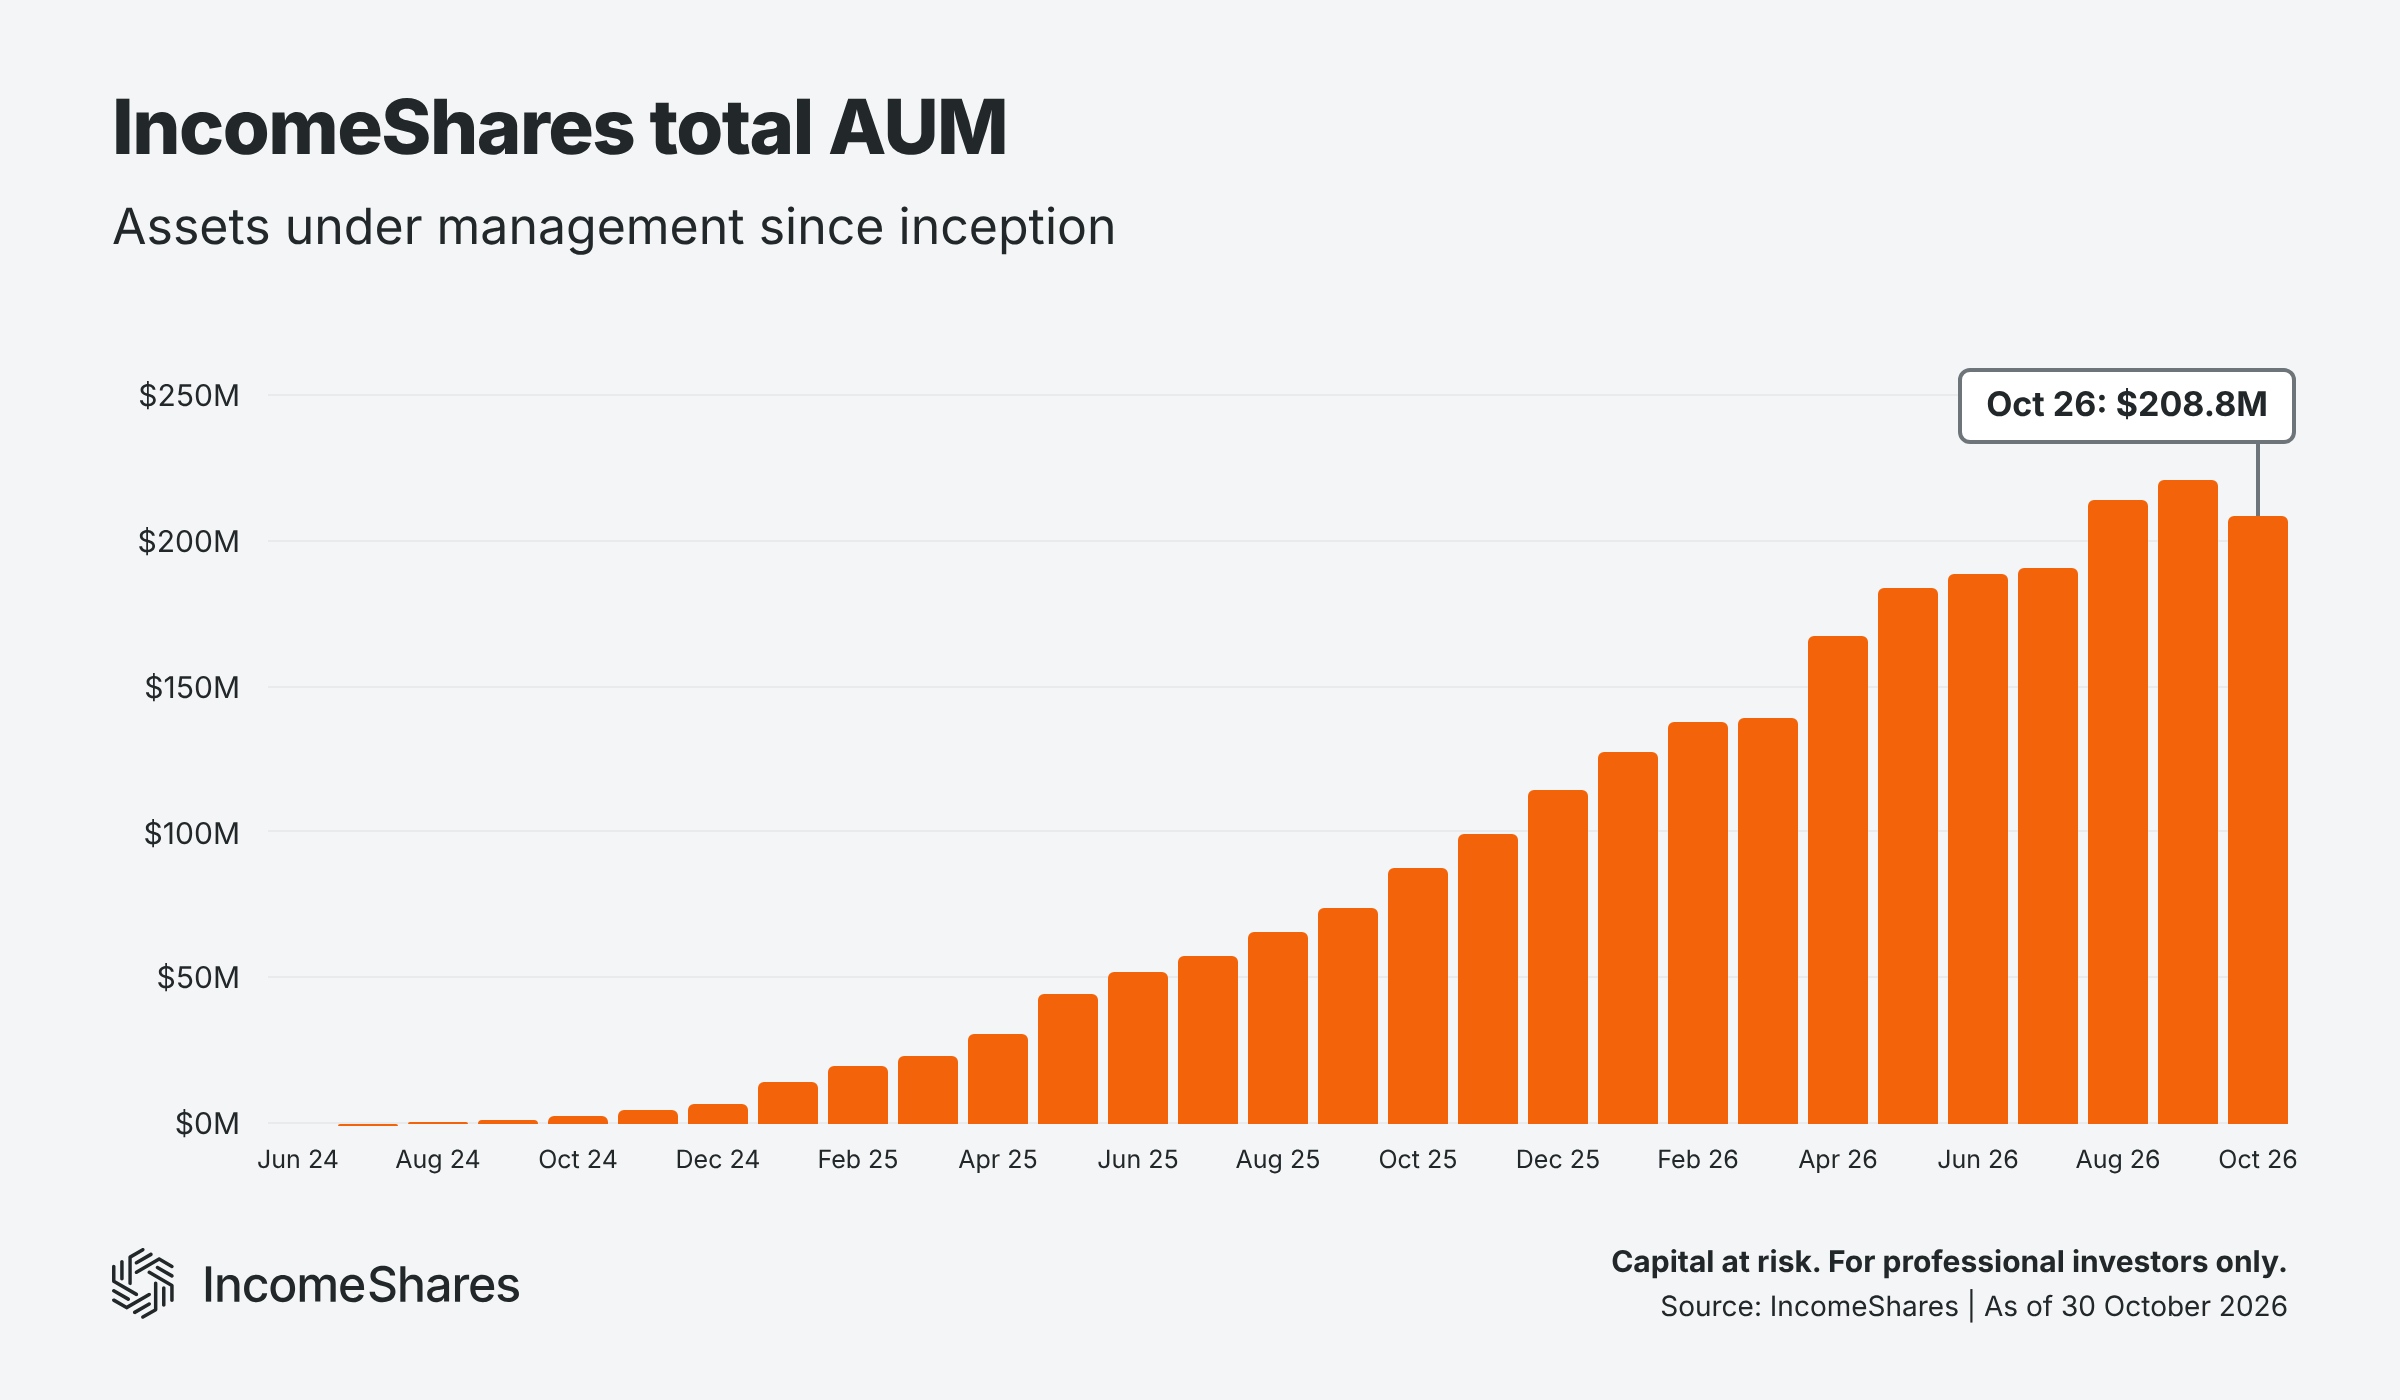
Total assets under management closed October at $208.8 million – down 5.5% from September. Investors added $10.8 million during the month, more than the $6.4 million of October income distributions. But market moves cut about $17 million from AUM, as most of the assets behind the ETPs fell in value. The chart below breaks down the change.
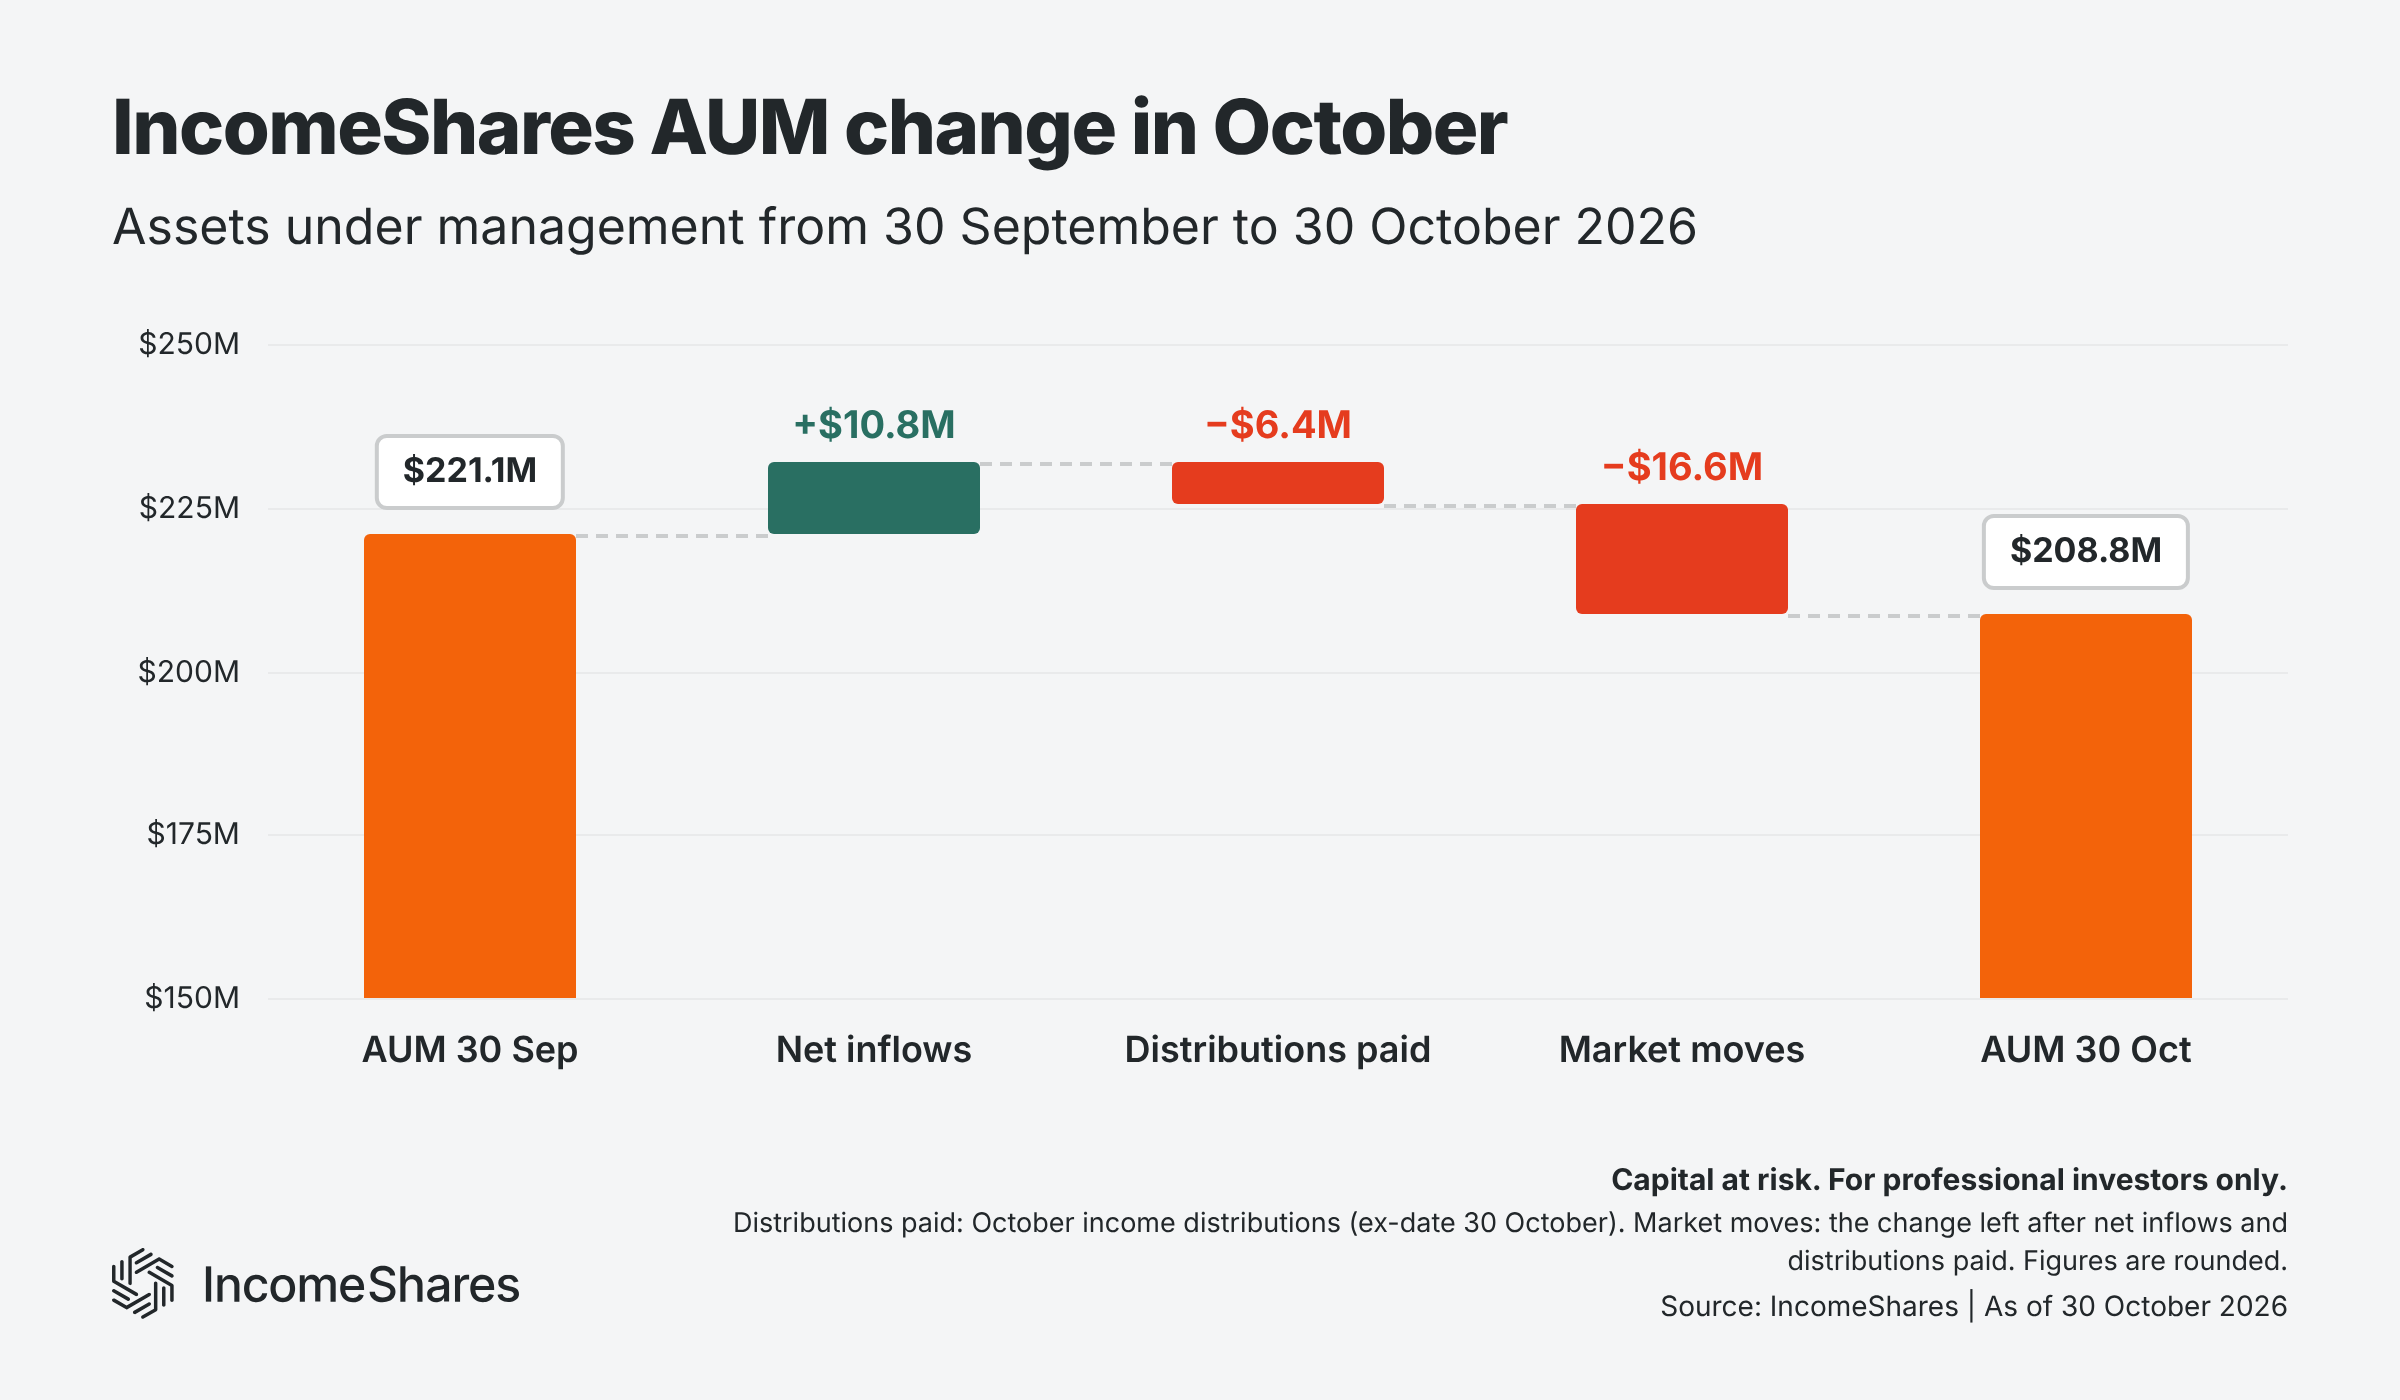
Most of that fall came from two parts of the market. Tech stocks fell: the Nasdaq 100 dropped about 7% in October, against about 1% for the S&P 500. Several of the stocks behind the larger single-stock ETPs fell further. NVIDIA dropped about 10%, and Alphabet and AMD about 18% each. Gold and silver also fell, by nearly 7% and about 18%, respectively. Gold+ Yield and Silver+ Yield (which hold gold and silver exposure) made up about 30% of AUM in September.
Gold+ Yield is still our largest ETP, with $54.0 million in AUM. The Magnificent 7, Nasdaq 100, Silver+ Yield, and 20+ Year Treasury ETPs followed. They ended October with $15.6, $12.9, $11.7, and $10.0 million, respectively. Together with Gold+ Yield, these five ETPs currently account for about half of total AUM.
Cumulative fund flows
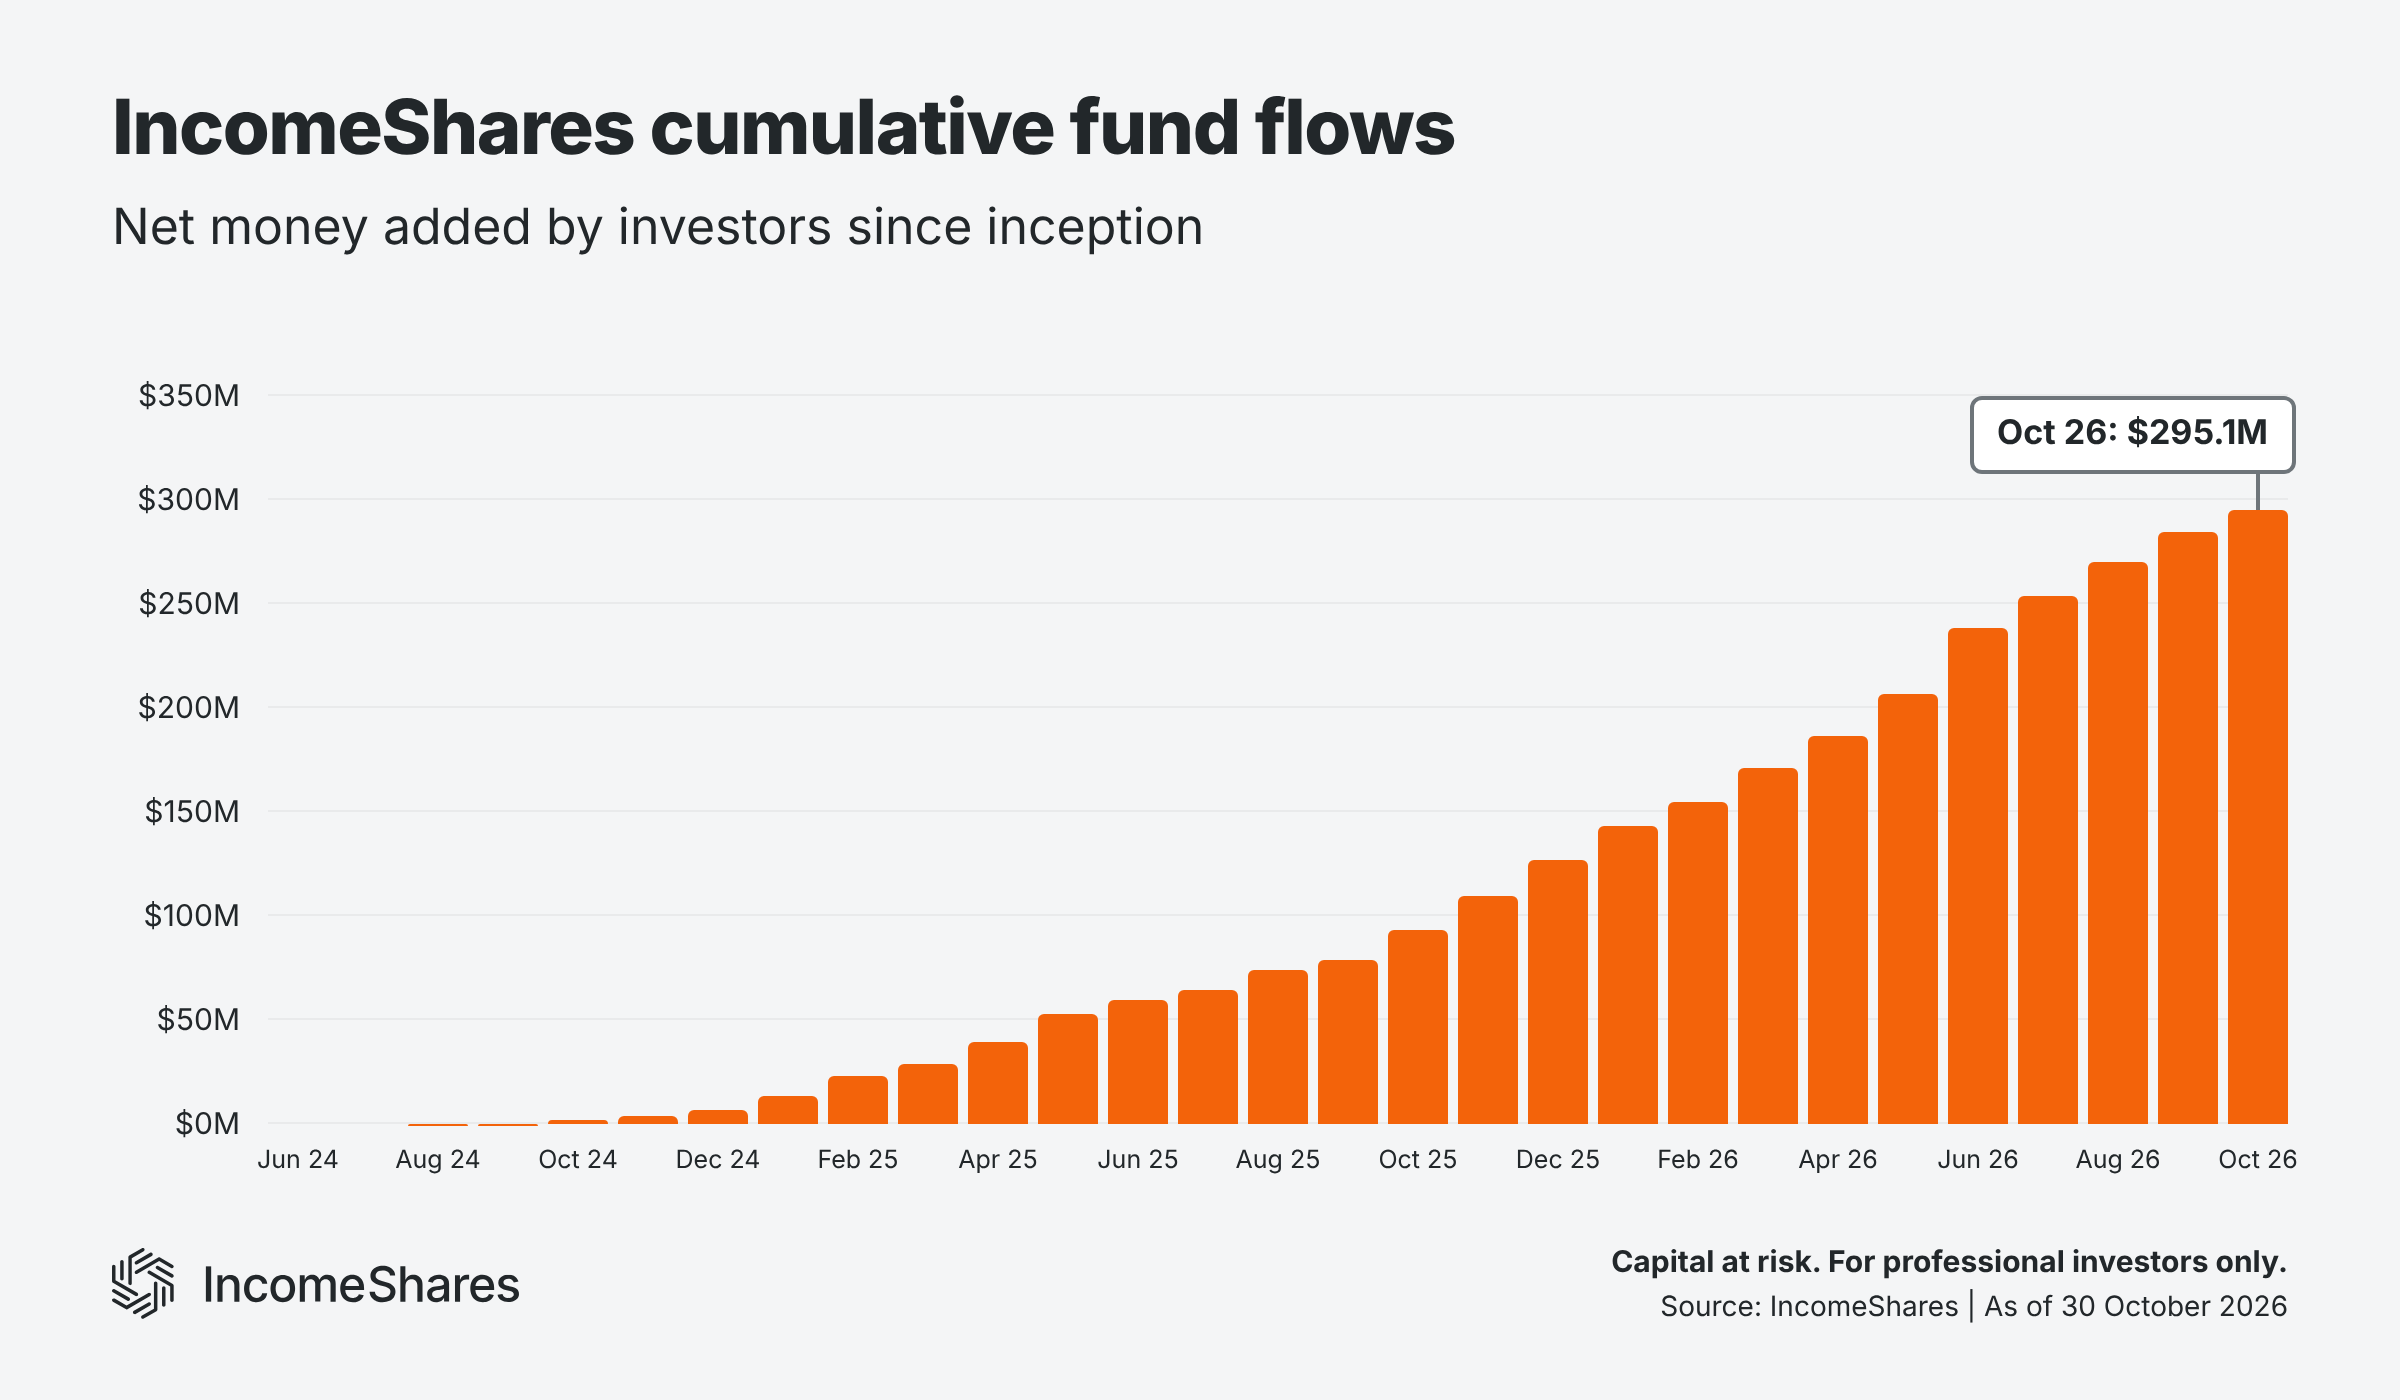
Cumulative fund flows reached $295.1 million by the end of October – a 3.8% increase from September. This metric tracks the net amount of money investors have added to IncomeShares ETPs since inception.
Net inflows came to $10.8 million for the month. Gold+ Yield added $4.1 million – the biggest net inflows of the range. The 20+ Year Treasury and Silver+ Yield ETPs followed, adding $1.2 and $1.0 million, respectively. Investors added money to Gold+ Yield and Silver+ Yield even as gold and silver fell.
Marvell Technology had the largest net outflows, at $1.0 million. Its share price fell about 26% in October, as most chip stocks fell.
Net inflows for 2026 so far have reached $168.3 million. That's already more than the $120.2 million investors added in the whole of 2025.
Total fund flows also have risen every month since inception, and continue to exceed total AUM. That's expected for ETPs that pay monthly income. IncomeShares ETPs aim to fund distributions from the option premiums each strategy collects. When we pay that income out, the net asset value (NAV) falls by the payout amount – so cumulative inflows can naturally run ahead of AUM over time. Market moves change AUM but not fund flows, so October's falls also widened the difference between the two.
Trading turnover
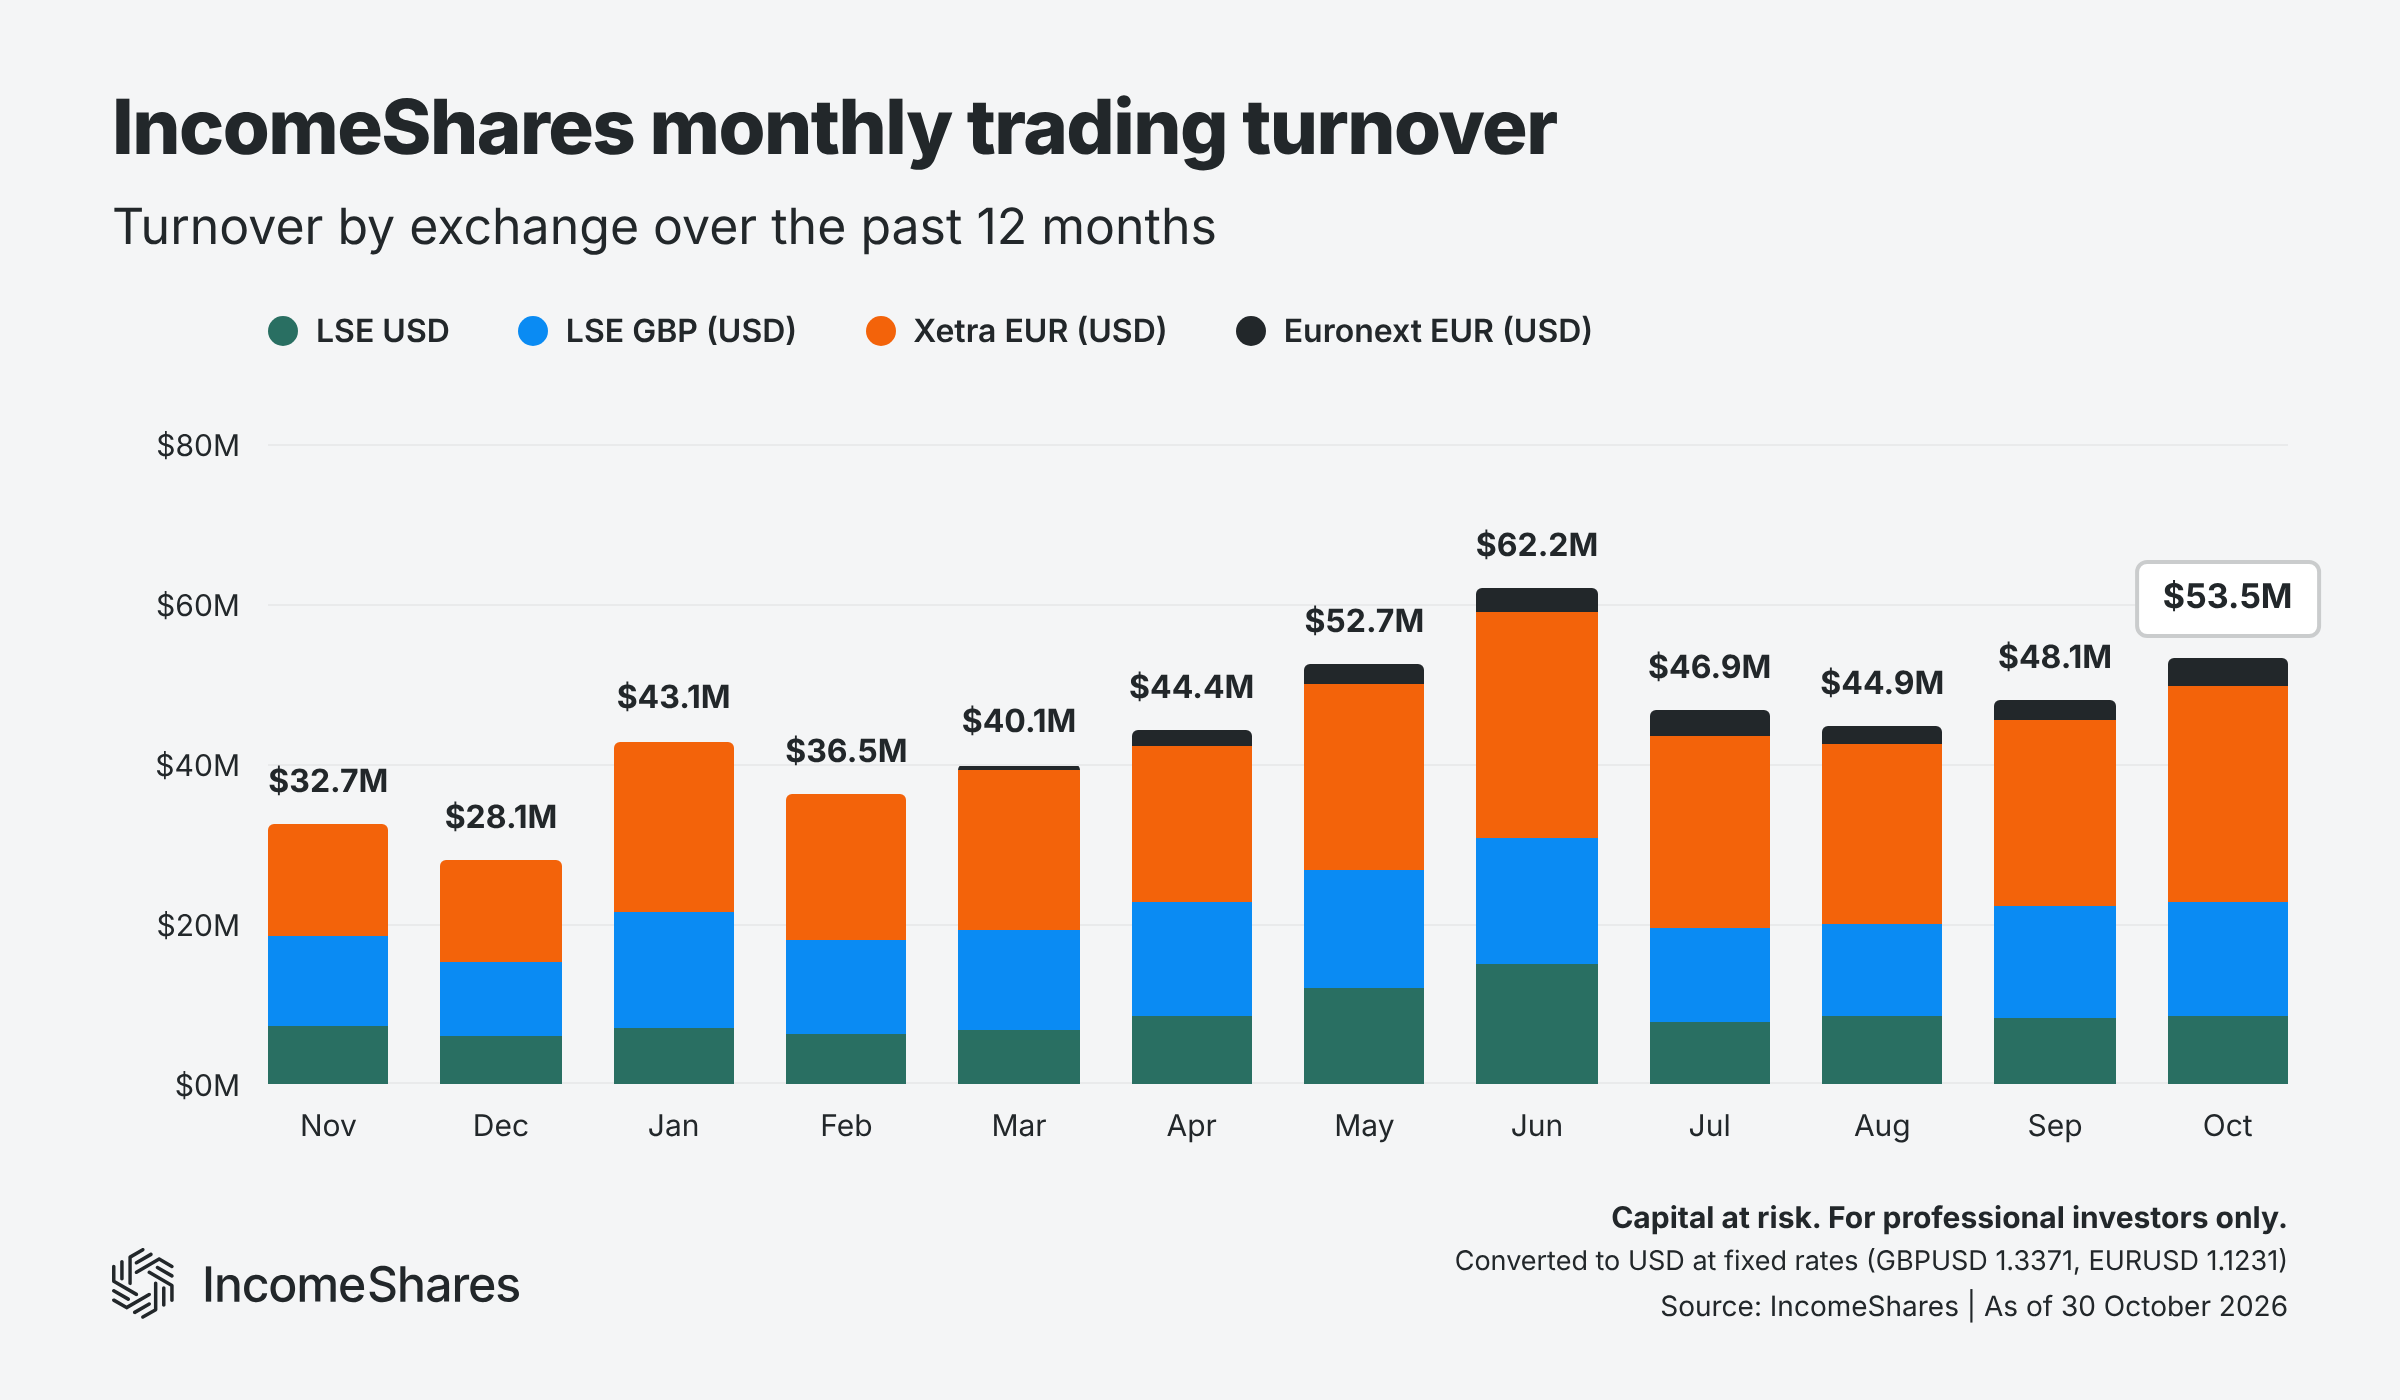
Total IncomeShares trading activity reached $53.5 million across exchanges in October – up about 11% from September.
Xetra led the way with $27.1 million in total turnover. The London Stock Exchange followed with $22.9 million. GBP-denominated ETPs traded $14.2 million there, with USD ETPs at $8.7 million. Euronext Amsterdam added $3.6 million – its highest monthly turnover so far.
Note: Turnover figures use fixed FX rates to convert GBP and EUR into USD (GBPUSD 1.3371, EURUSD 1.1231). The chart shows every month at these rates. They aren't directly comparable with turnover figures in earlier updates, which used different rates.
Distribution yields
Distribution yields represent the annualised income paid to investors as a percentage of an ETP's net asset value, based on the latest month's distribution. IncomeShares ETPs aim to generate this income from selling options. Yields can change each month depending on strategy performance and market volatility. A rising yield percentage doesn't always mean a bigger payout, since the yield also depends on net asset value.
Of the 56 ETPs that paid in September and October, 31 yields rose, 22 fell, and 3 were flat.
The Texas Instruments ETP rose from 37% to 61%. Texas Instruments reported revenue of $6.06 billion on 21 October, up 28% year on year. UnitedHealth rose from 36% to 55% after the company raised its full-year guidance on 13 October. The Tesla and Netflix ETPs rose from 37% to 49% and from 35% to 46%, respectively. Netflix reported results on 20 October, and Tesla on 21 October. Implied volatility has tended to rise into earnings, which can mean larger premiums for options sellers.
The Super Micro Computer ETP rose from 57% to 87%. On 20 October, Super Micro estimated its revenue for the quarter to September at $18.5 to $19.5 billion. That was well above its August guidance of $14.5 to $15.5 billion. Marvell Technology rose from 54% to 83%, and Amazon from 26% to 44%.
Digital asset ETPs again paid the highest yields of the range. IREN paid 113%, Mara 107%, and Riot 94%. Bitcoin fell about 7% in October to around $77,400. Bitmine fell from 99% to 78%, Circle Internet from 99% to 79%, and Coinbase from 79% to 58%.
In commodities, Silver Miners+ Yield rose from 21% to 35%. Gold Miners+ Yield fell from 55% to 42%, and WTI Oil+ Yield from 68% to 52%. Gold+ Yield, Silver+ Yield, and 20+ Year Treasury all paid 12% annualised – or 1% a month, unchanged.
In late October, we raised the direct exposure across our put-selling ETPs to about 50%. Put options made up the rest. Our strategy update explains what's changing, and why distributions may change as each ETP moves over.
October annualised distribution yields ranked from highest to lowest:
IREN Options ETP: 113.3%
Mara Options ETP: 106.5%
Riot Options ETP: 93.7%
CoreWeave Options ETP: 90.6%
Super Micro Computer Options ETP: 87.0%
ARM Options ETP: 83.6%
Marvell Technology Options ETP: 82.6%
Galaxy Digital Options ETP: 79.5%
Circle Internet Options ETP: 79.0%
Bitmine Options ETP: 77.7%
Intel Options ETP: 76.2%
Micron Options ETP: 71.6%
Oracle Options ETP: 70.1%
Lam Research Options ETP: 69.1%
Blockchain Leaders ETP: 68.2%
Strategy Options ETP: 67.8%
Robinhood Options ETP: 62.9%
Applied Materials Options ETP: 62.3%
Texas Instruments Options ETP: 60.7%
Semiconductors Leaders ETP: 58.3%
Coinbase Options ETP: 58.0%
Memory (DRAM) Options ETP: 57.2%
Palantir Options ETP: 55.6%
UnitedHealth Options ETP: 55.1%
SpaceX Options ETP: 55.0%
AMD Options ETP: 54.3%
QUALCOMM Options ETP: 53.0%
AI Leaders ETP: 52.9%
WTI Oil+ Yield ETP: 51.6%
Uranium+ Yield ETP: 49.5%
Taiwan Semiconductors Options ETP: 49.0%
Tesla Options ETP: 48.5%
Copper Miners+ Yield ETP: 48.4%
Nasdaq 100 Options ETP: 47.1%
ASML Options ETP: 46.5%
Alibaba Options ETP: 46.3%
Netflix Options ETP: 45.7%
Analog Devices Options ETP: 45.4%
Broadcom Options ETP: 45.1%
Amazon Options ETP: 44.2%
META Options ETP: 43.5%
Gold Miners+ Yield ETP: 41.9%
Alphabet Options ETP: 41.5%
Magnificent 7 Options ETP: 36.7%
Silver Miners+ Yield ETP: 34.9%
NVIDIA Options ETP: 34.8%
75/10/15 Multi-Asset Growth ETP: 33.9%
Microsoft Options ETP: 29.8%
S&P 500 Options ETP: 25.8%
Apple Options ETP: 22.8%
60/30/10 Multi-Asset Balanced ETP: 20.6%
Eurostoxx 50 Options ETP: 15.9%
Berkshire Hathaway Options ETP: 14.2%
20+ Year Treasury Options ETP: 12.0%
Silver+ Yield ETP: 12.0%
Gold+ Yield ETP: 12.0%
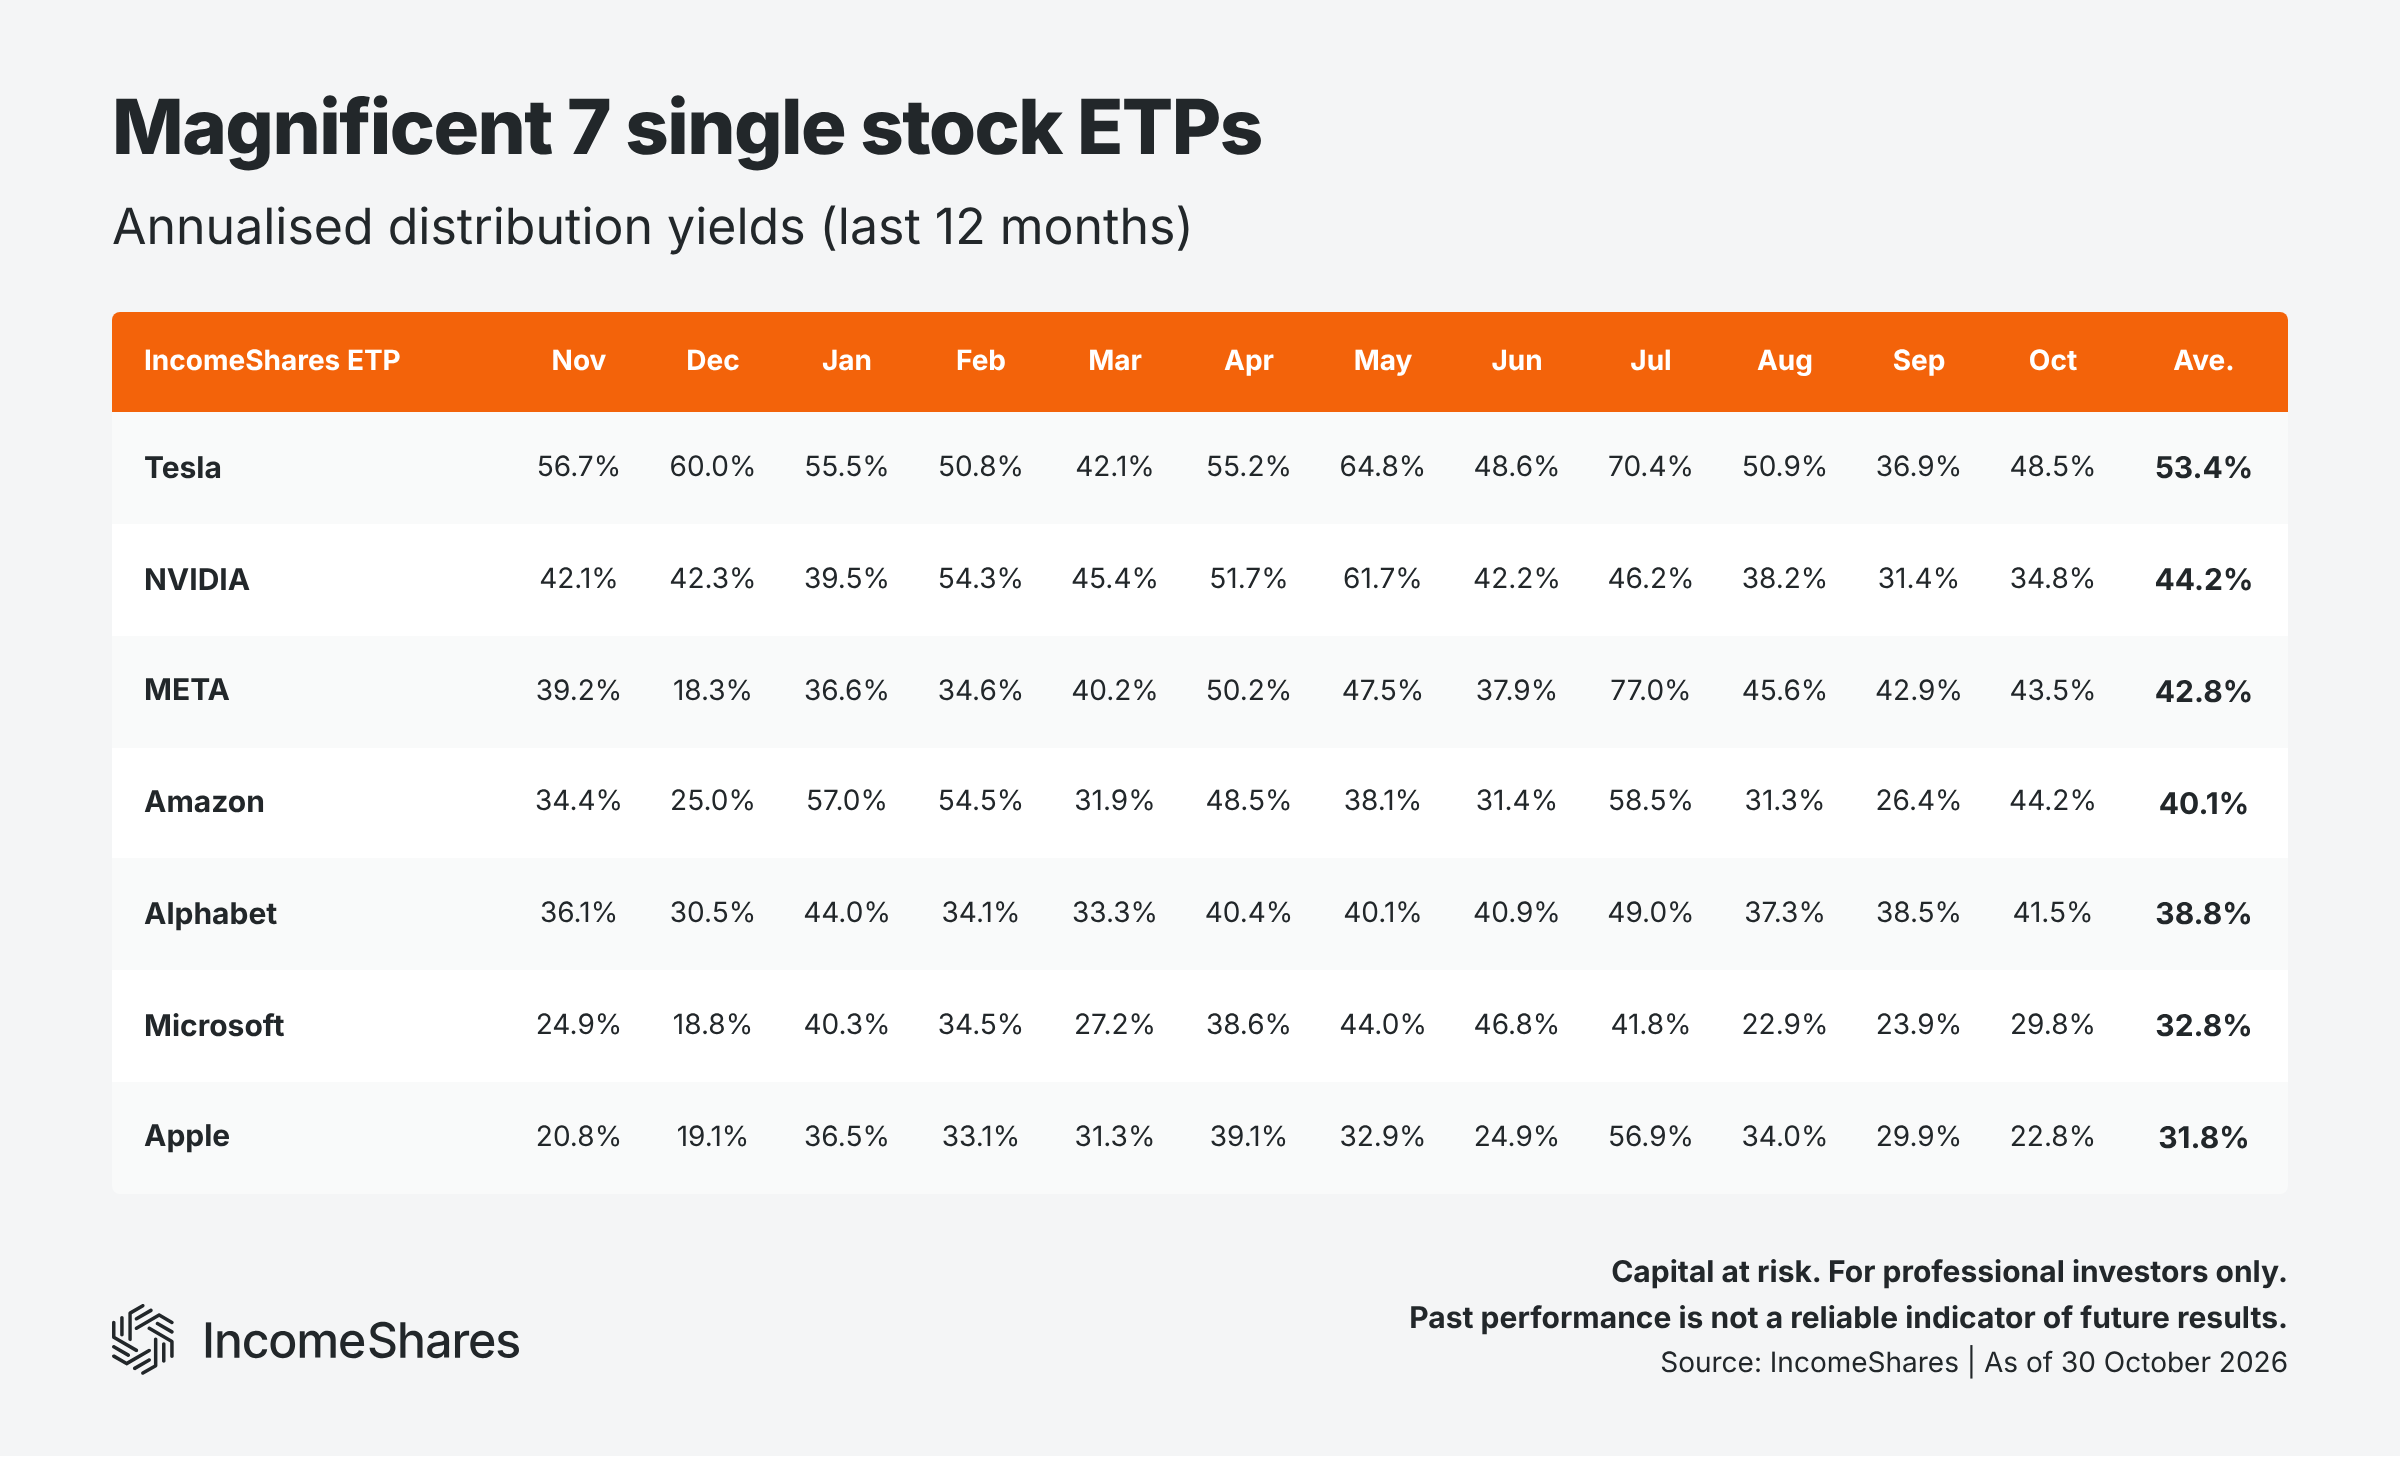
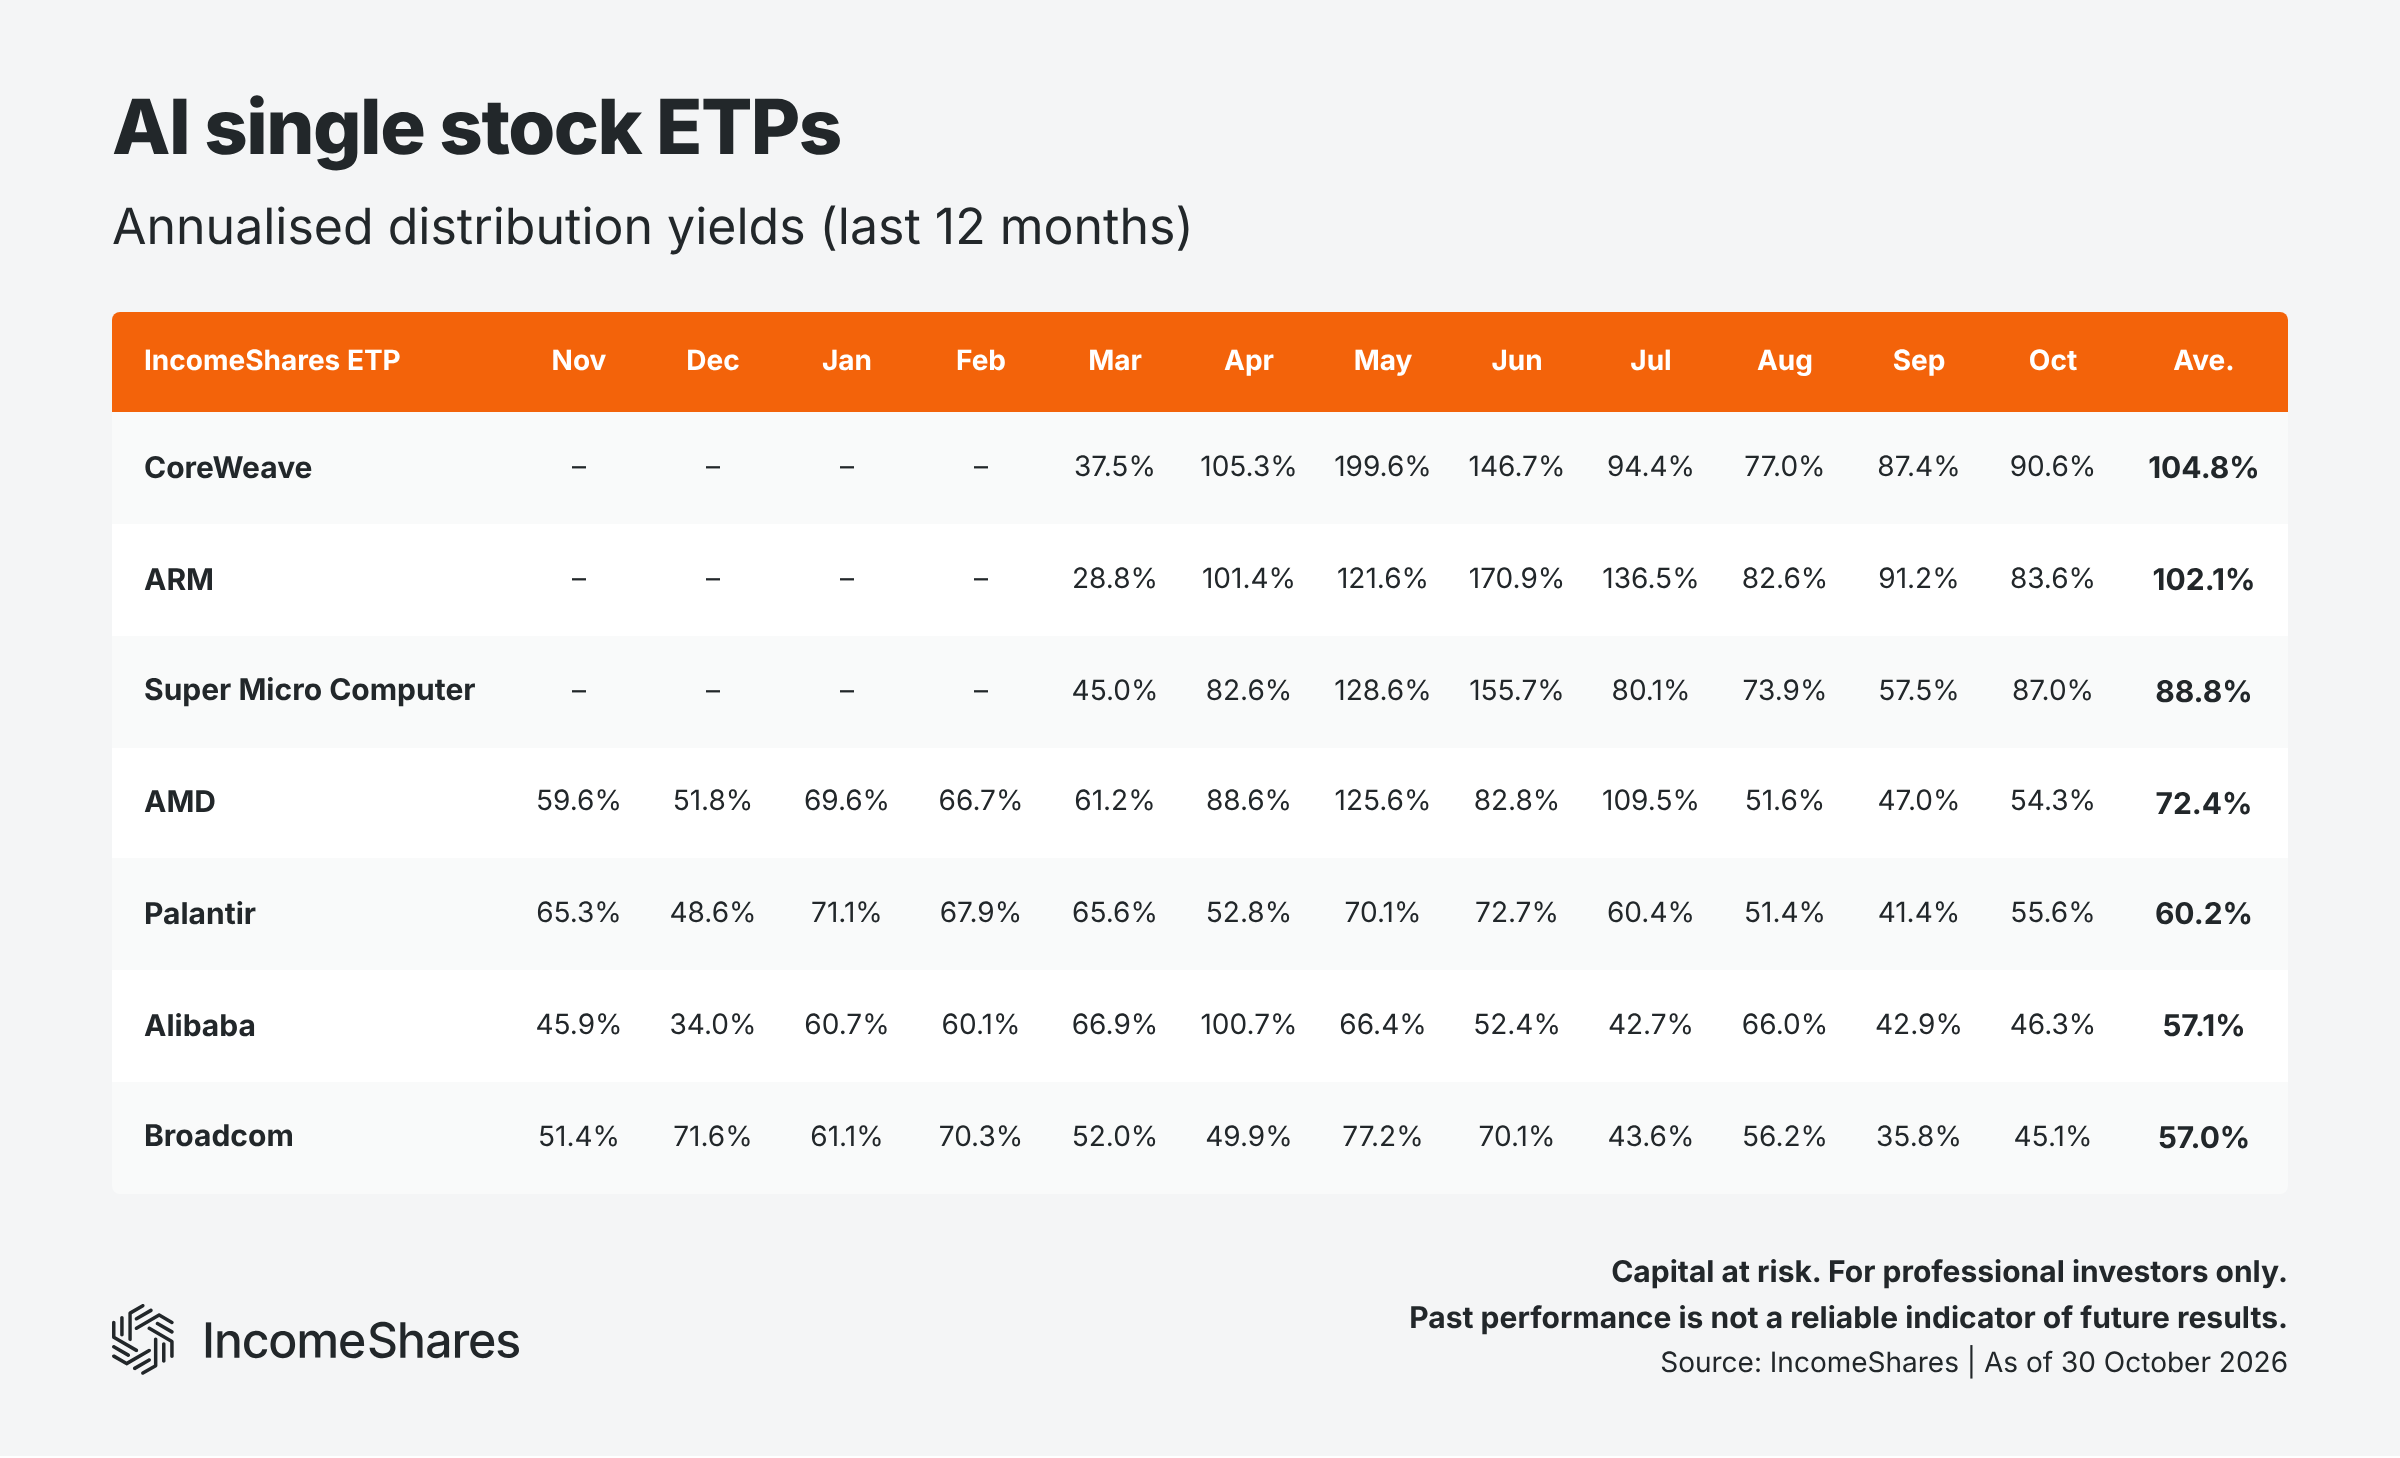
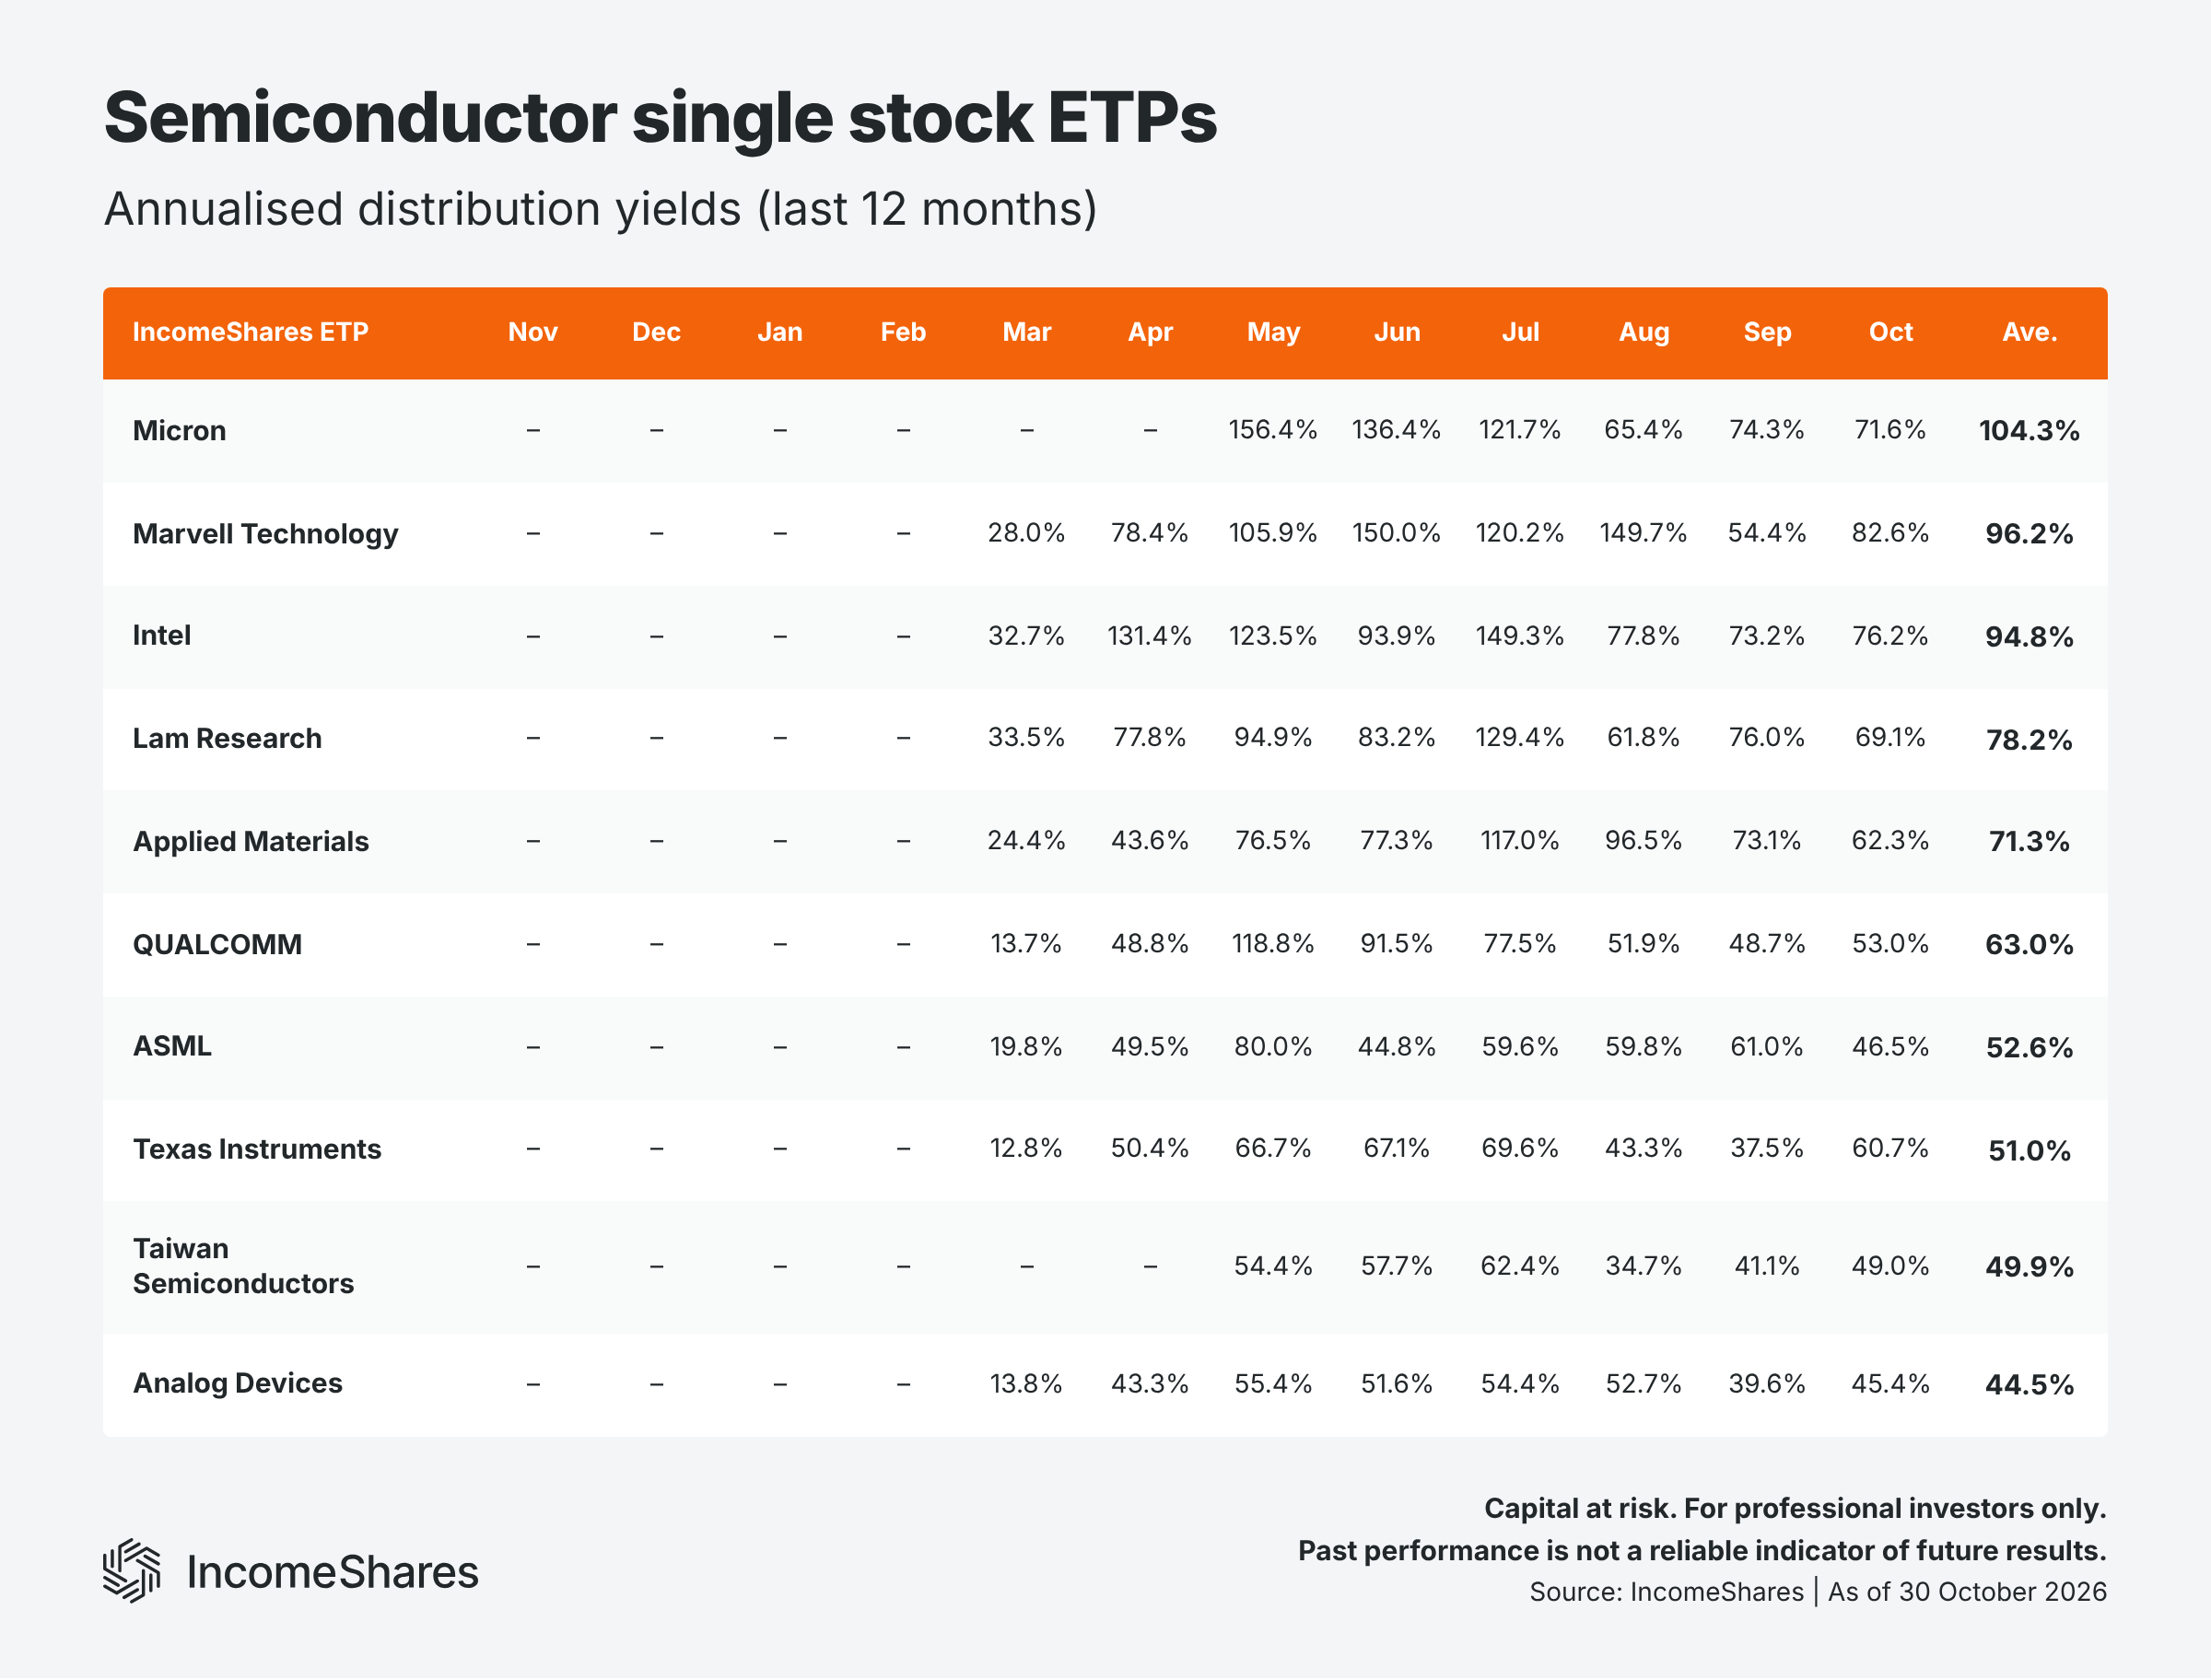
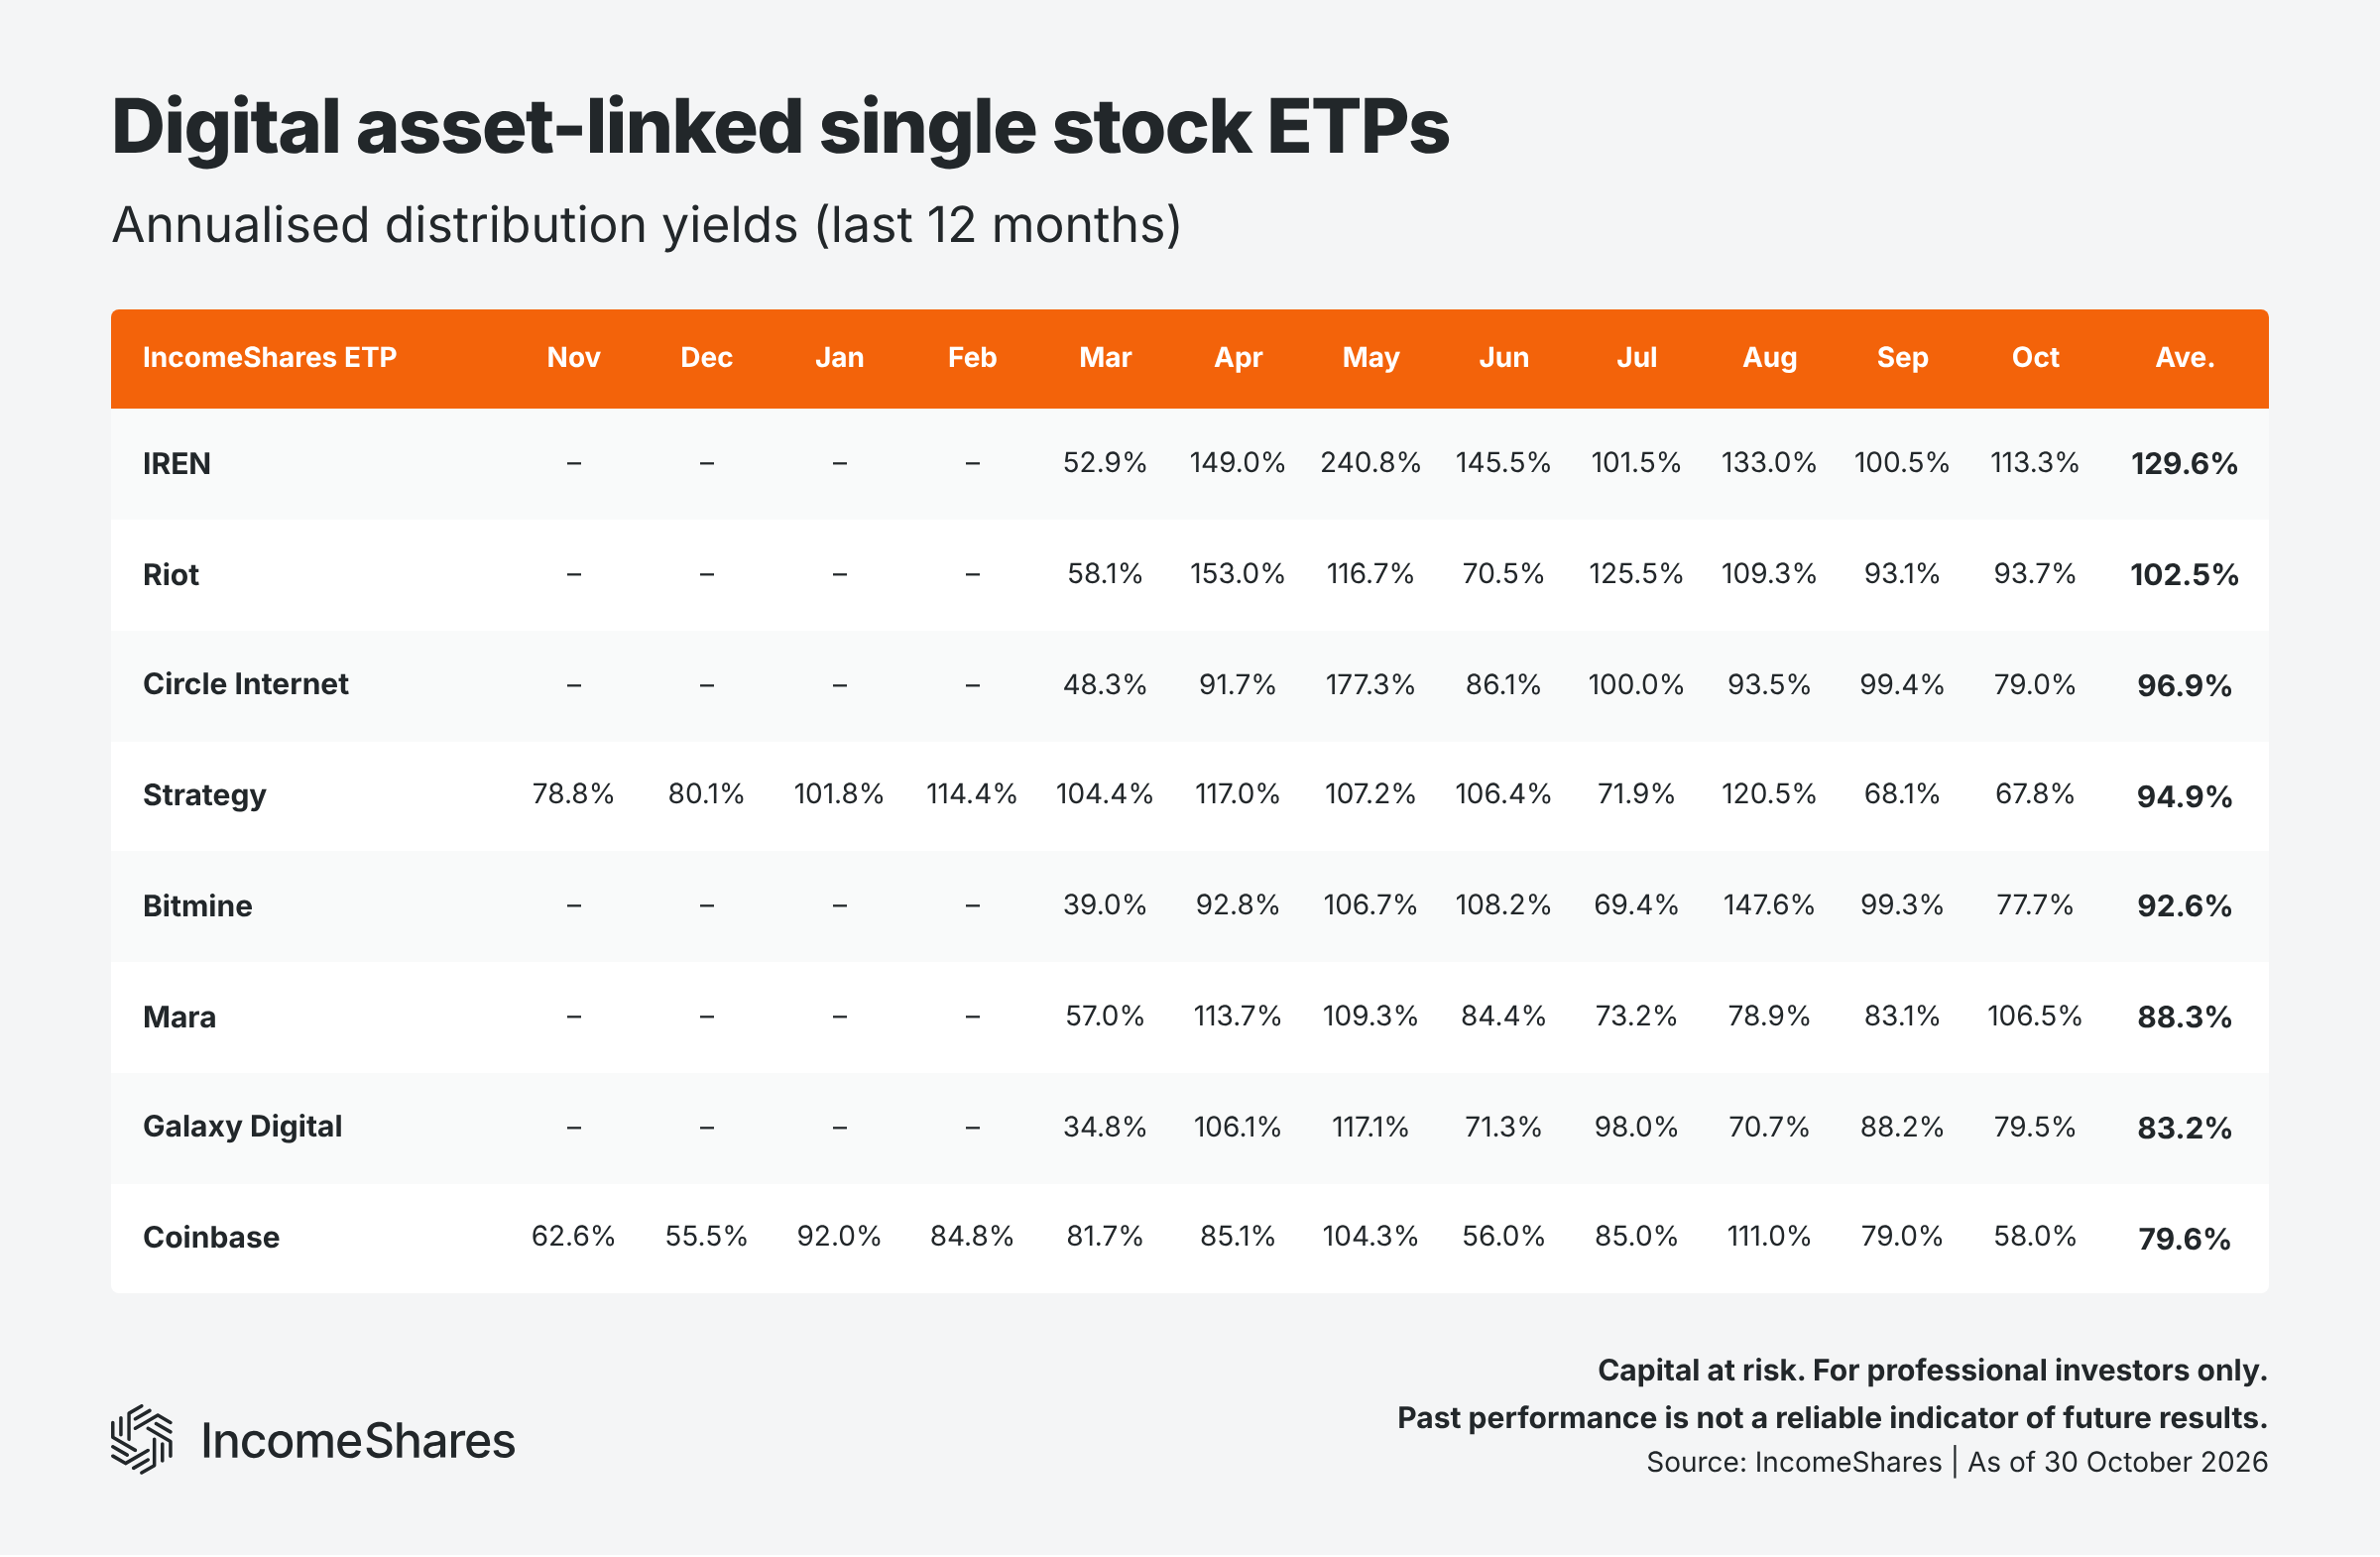
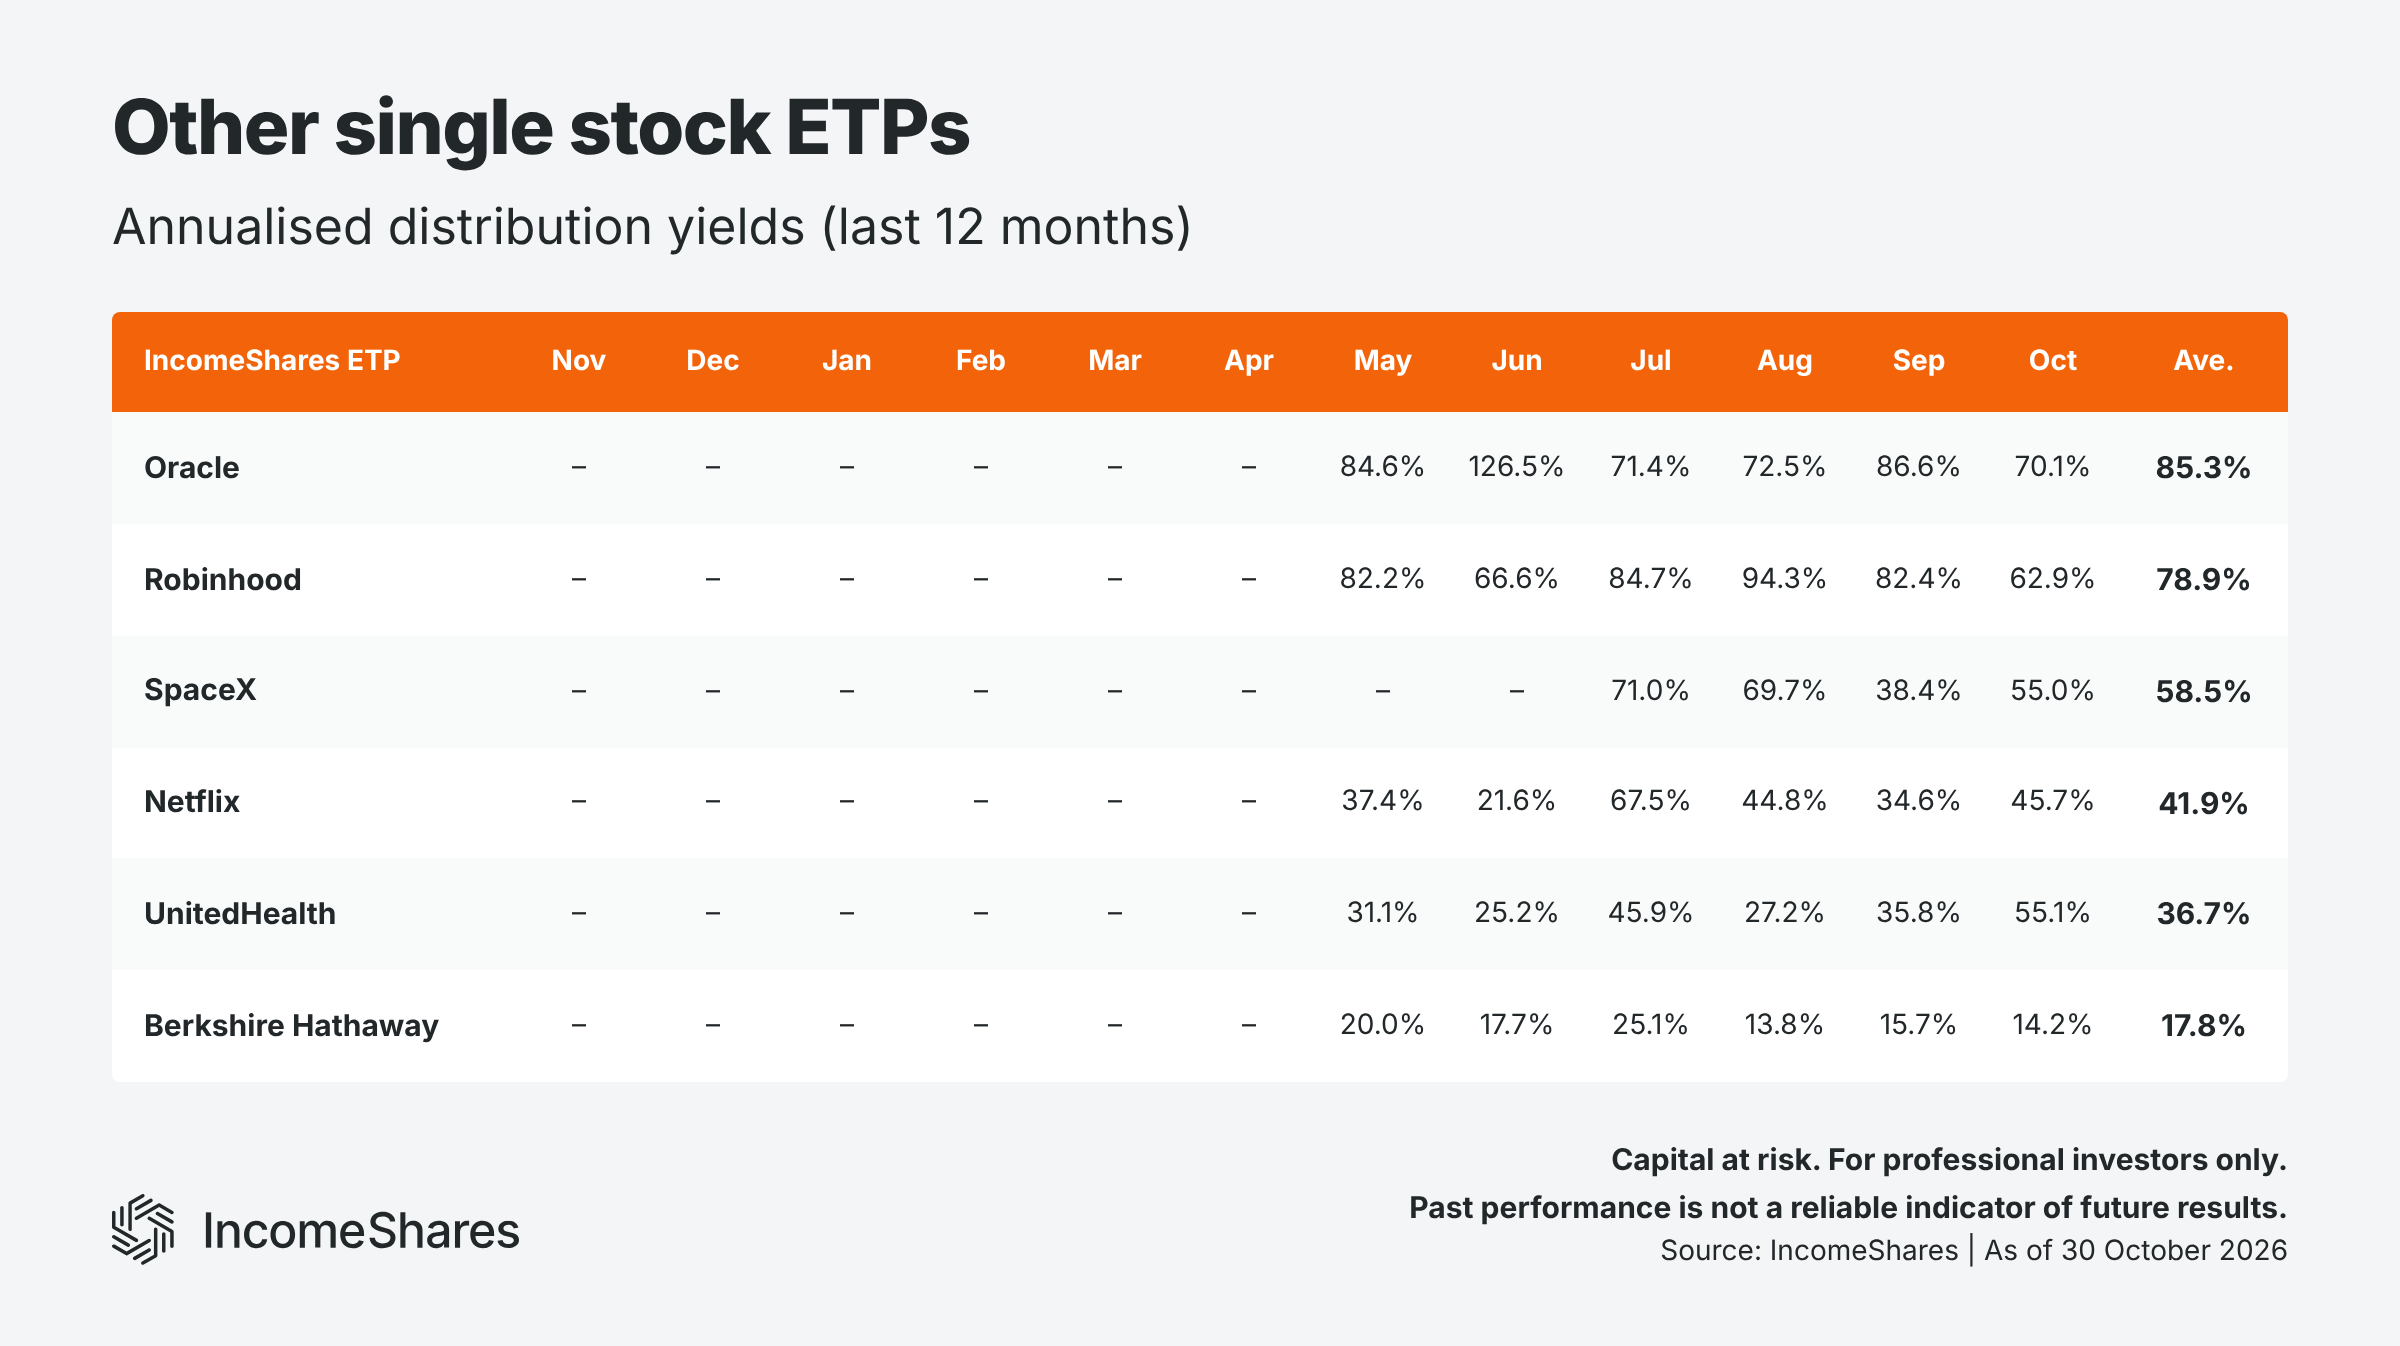
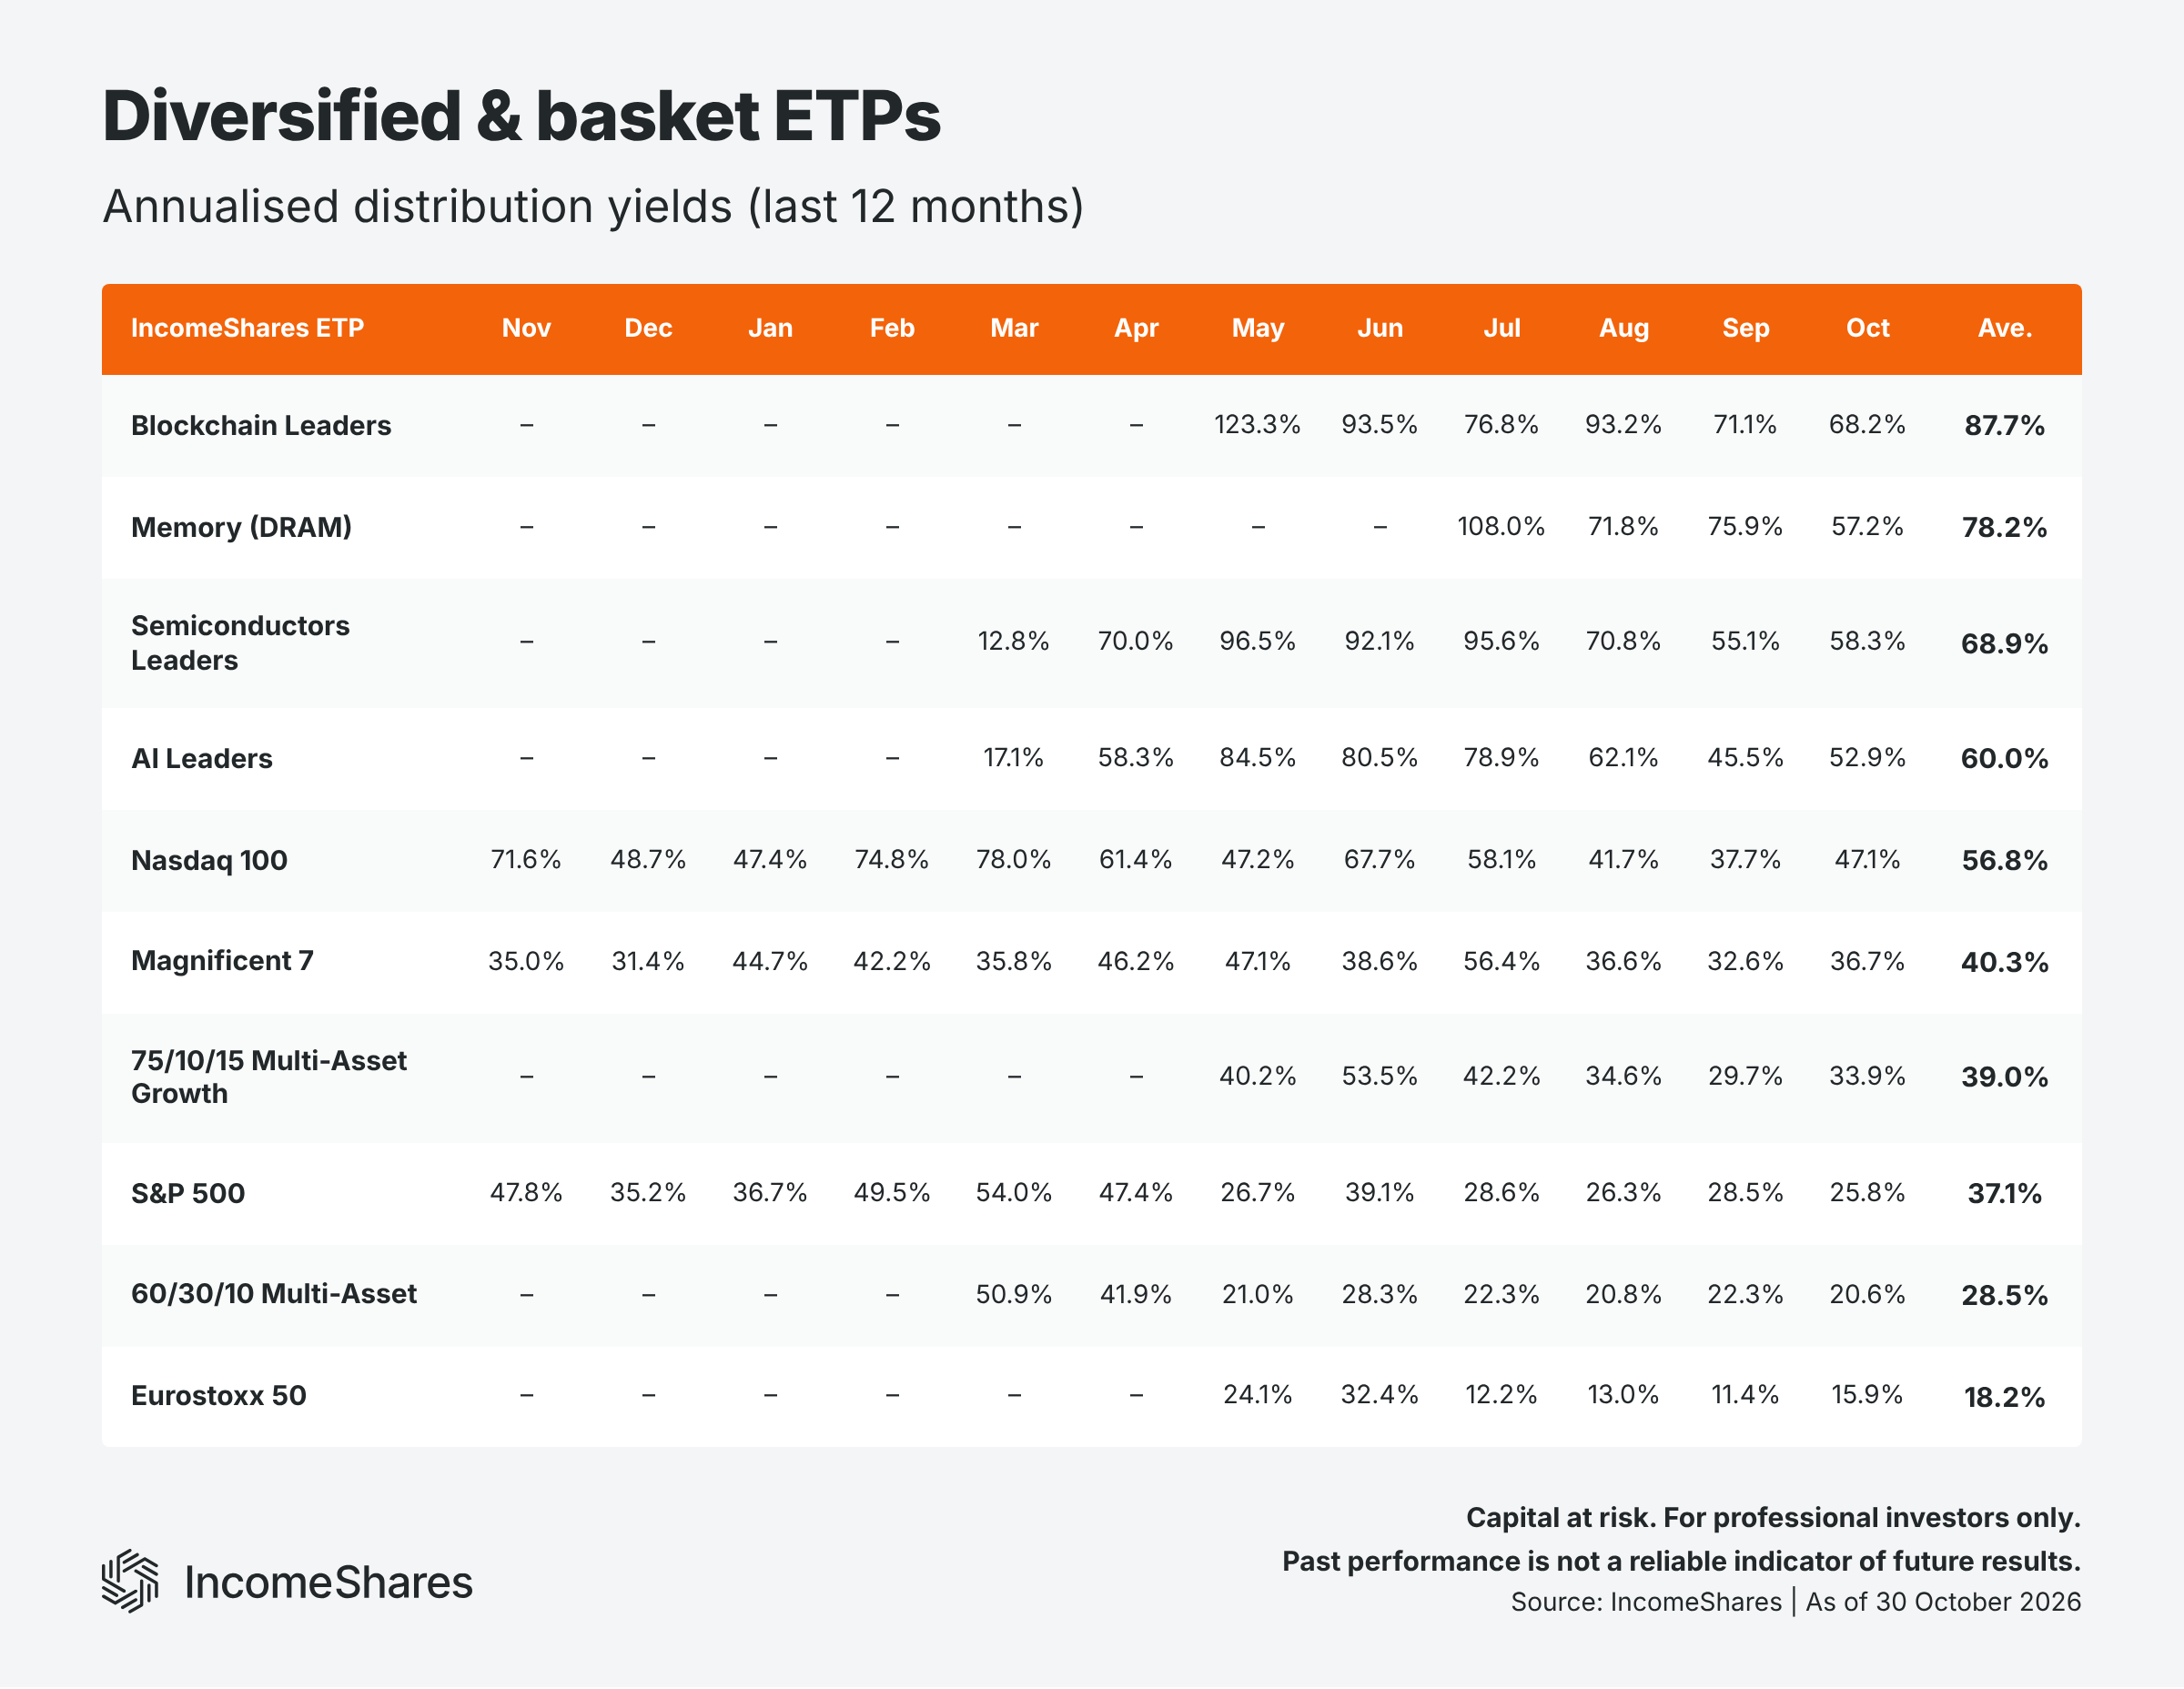
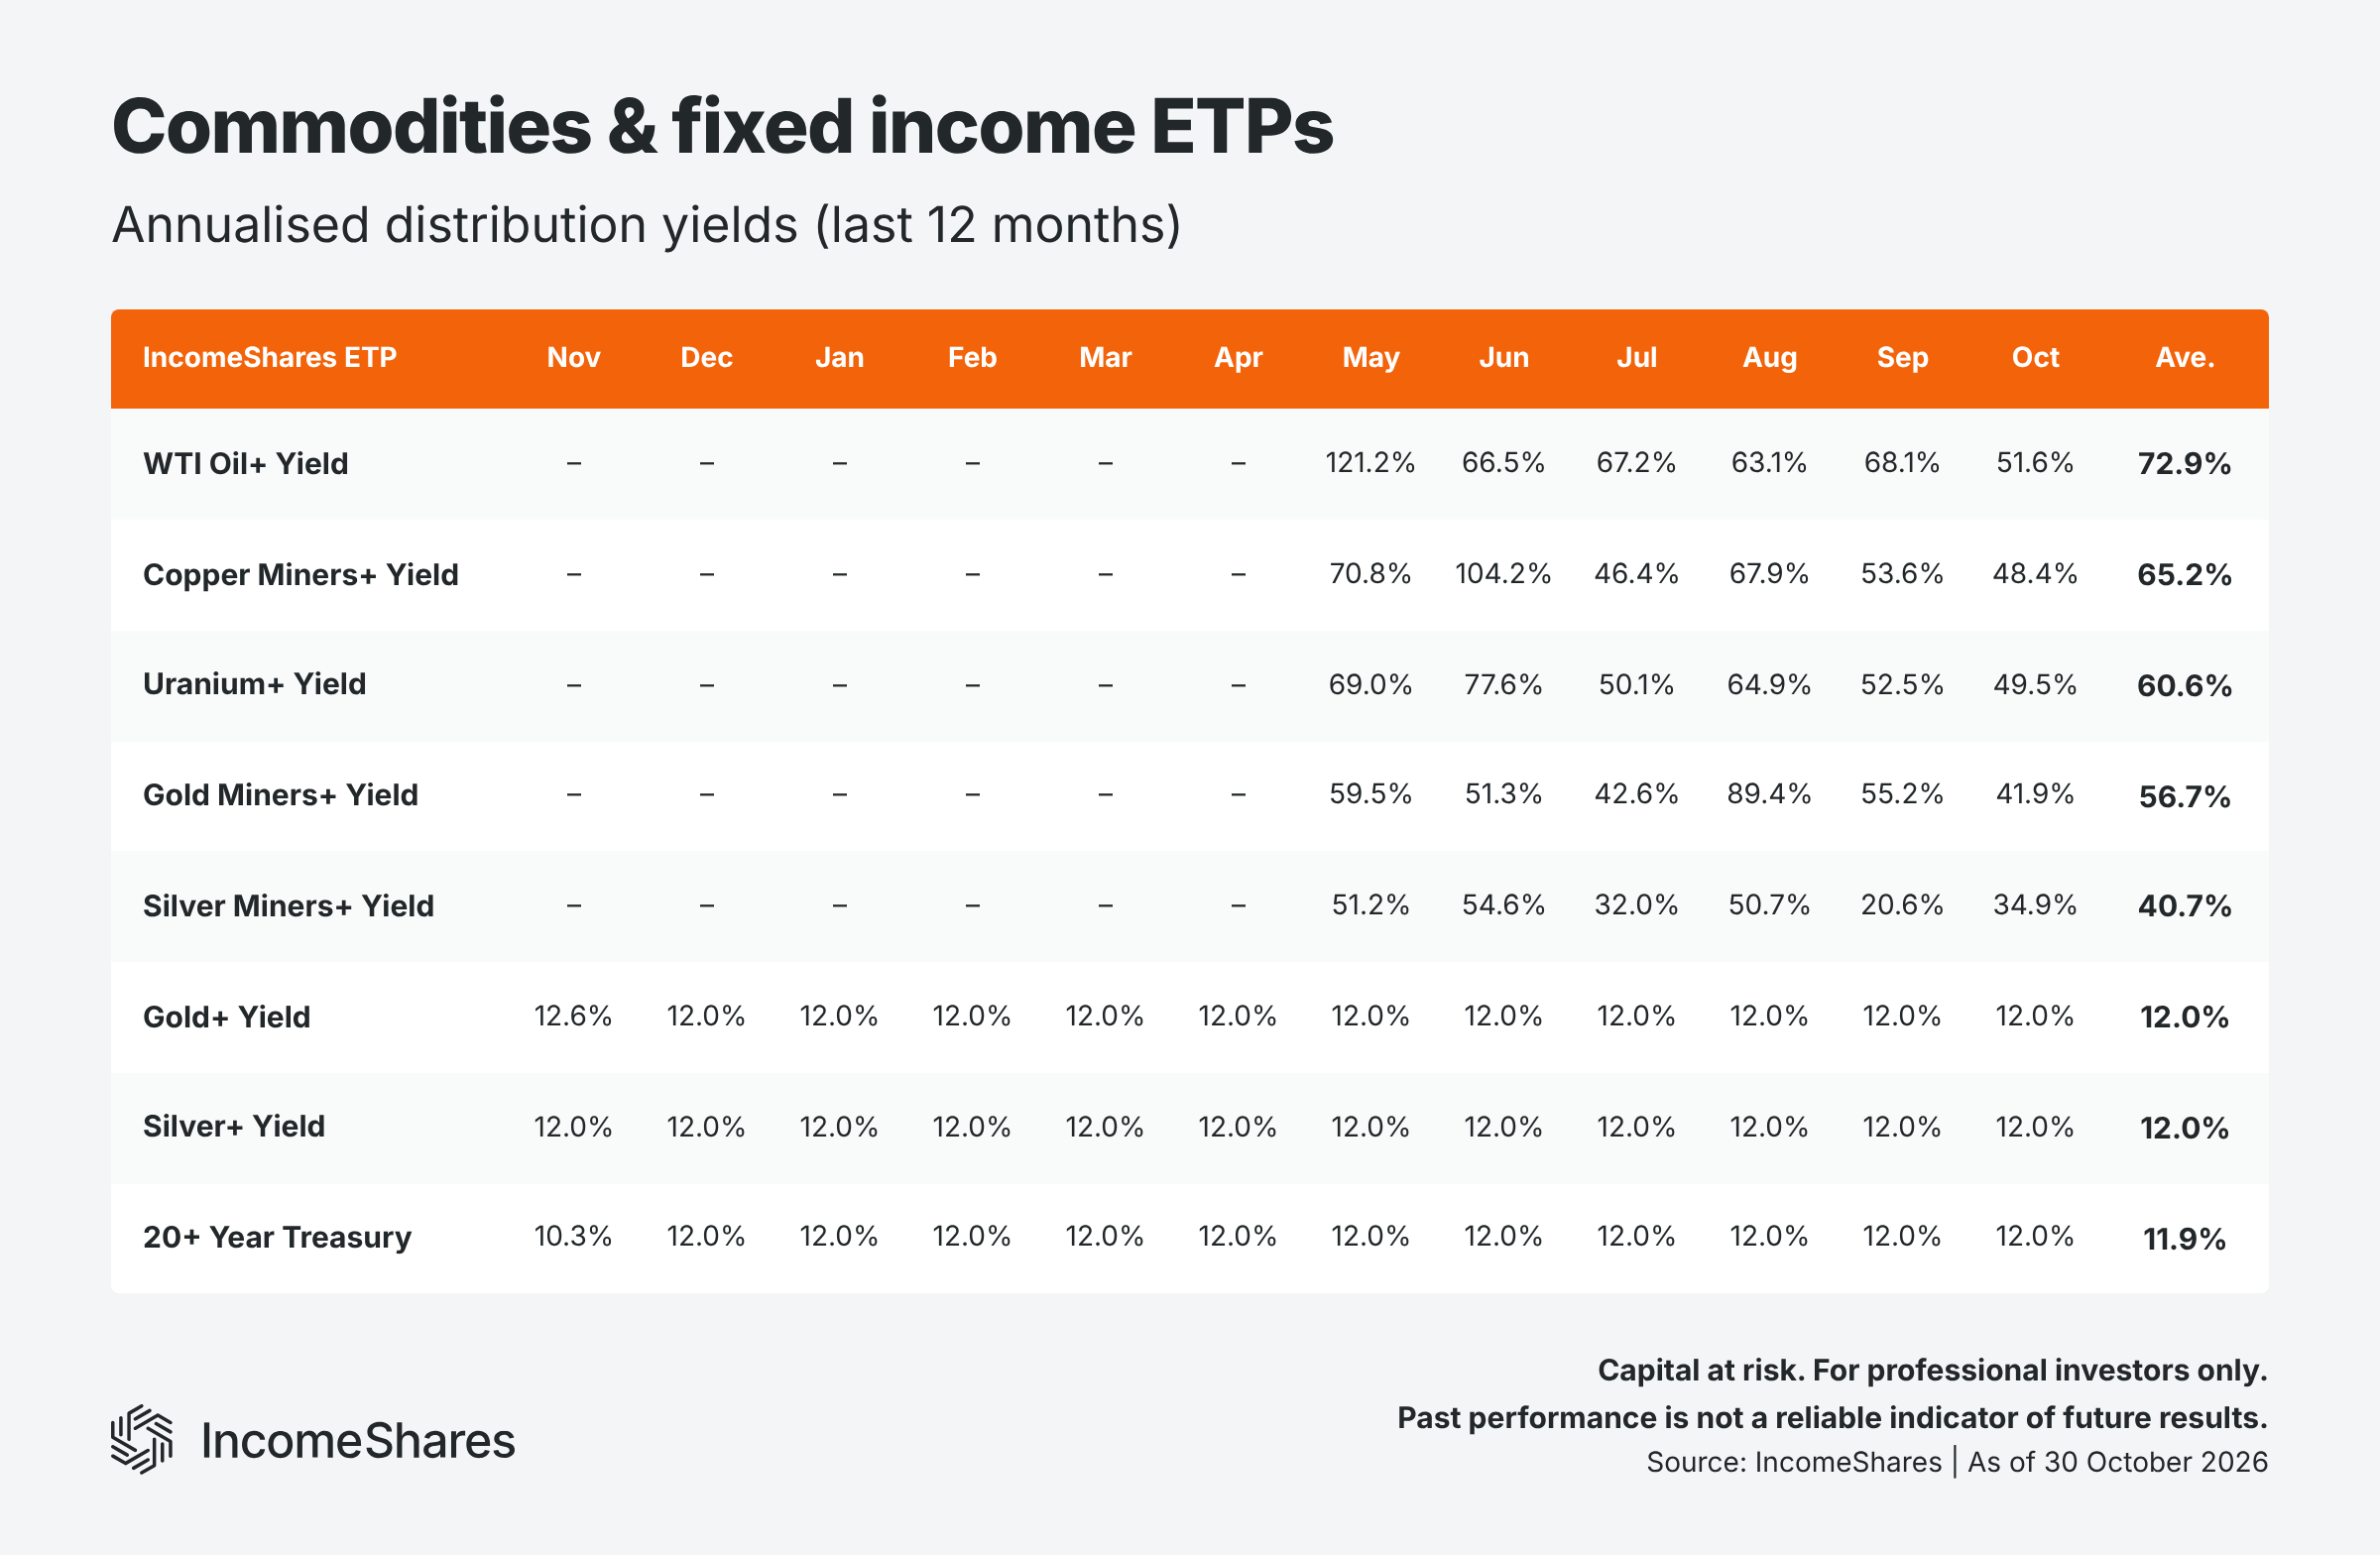
The tables below show each ETP's annualised distribution yields over the past 12 months (or since launch), grouped by type.
Total returns
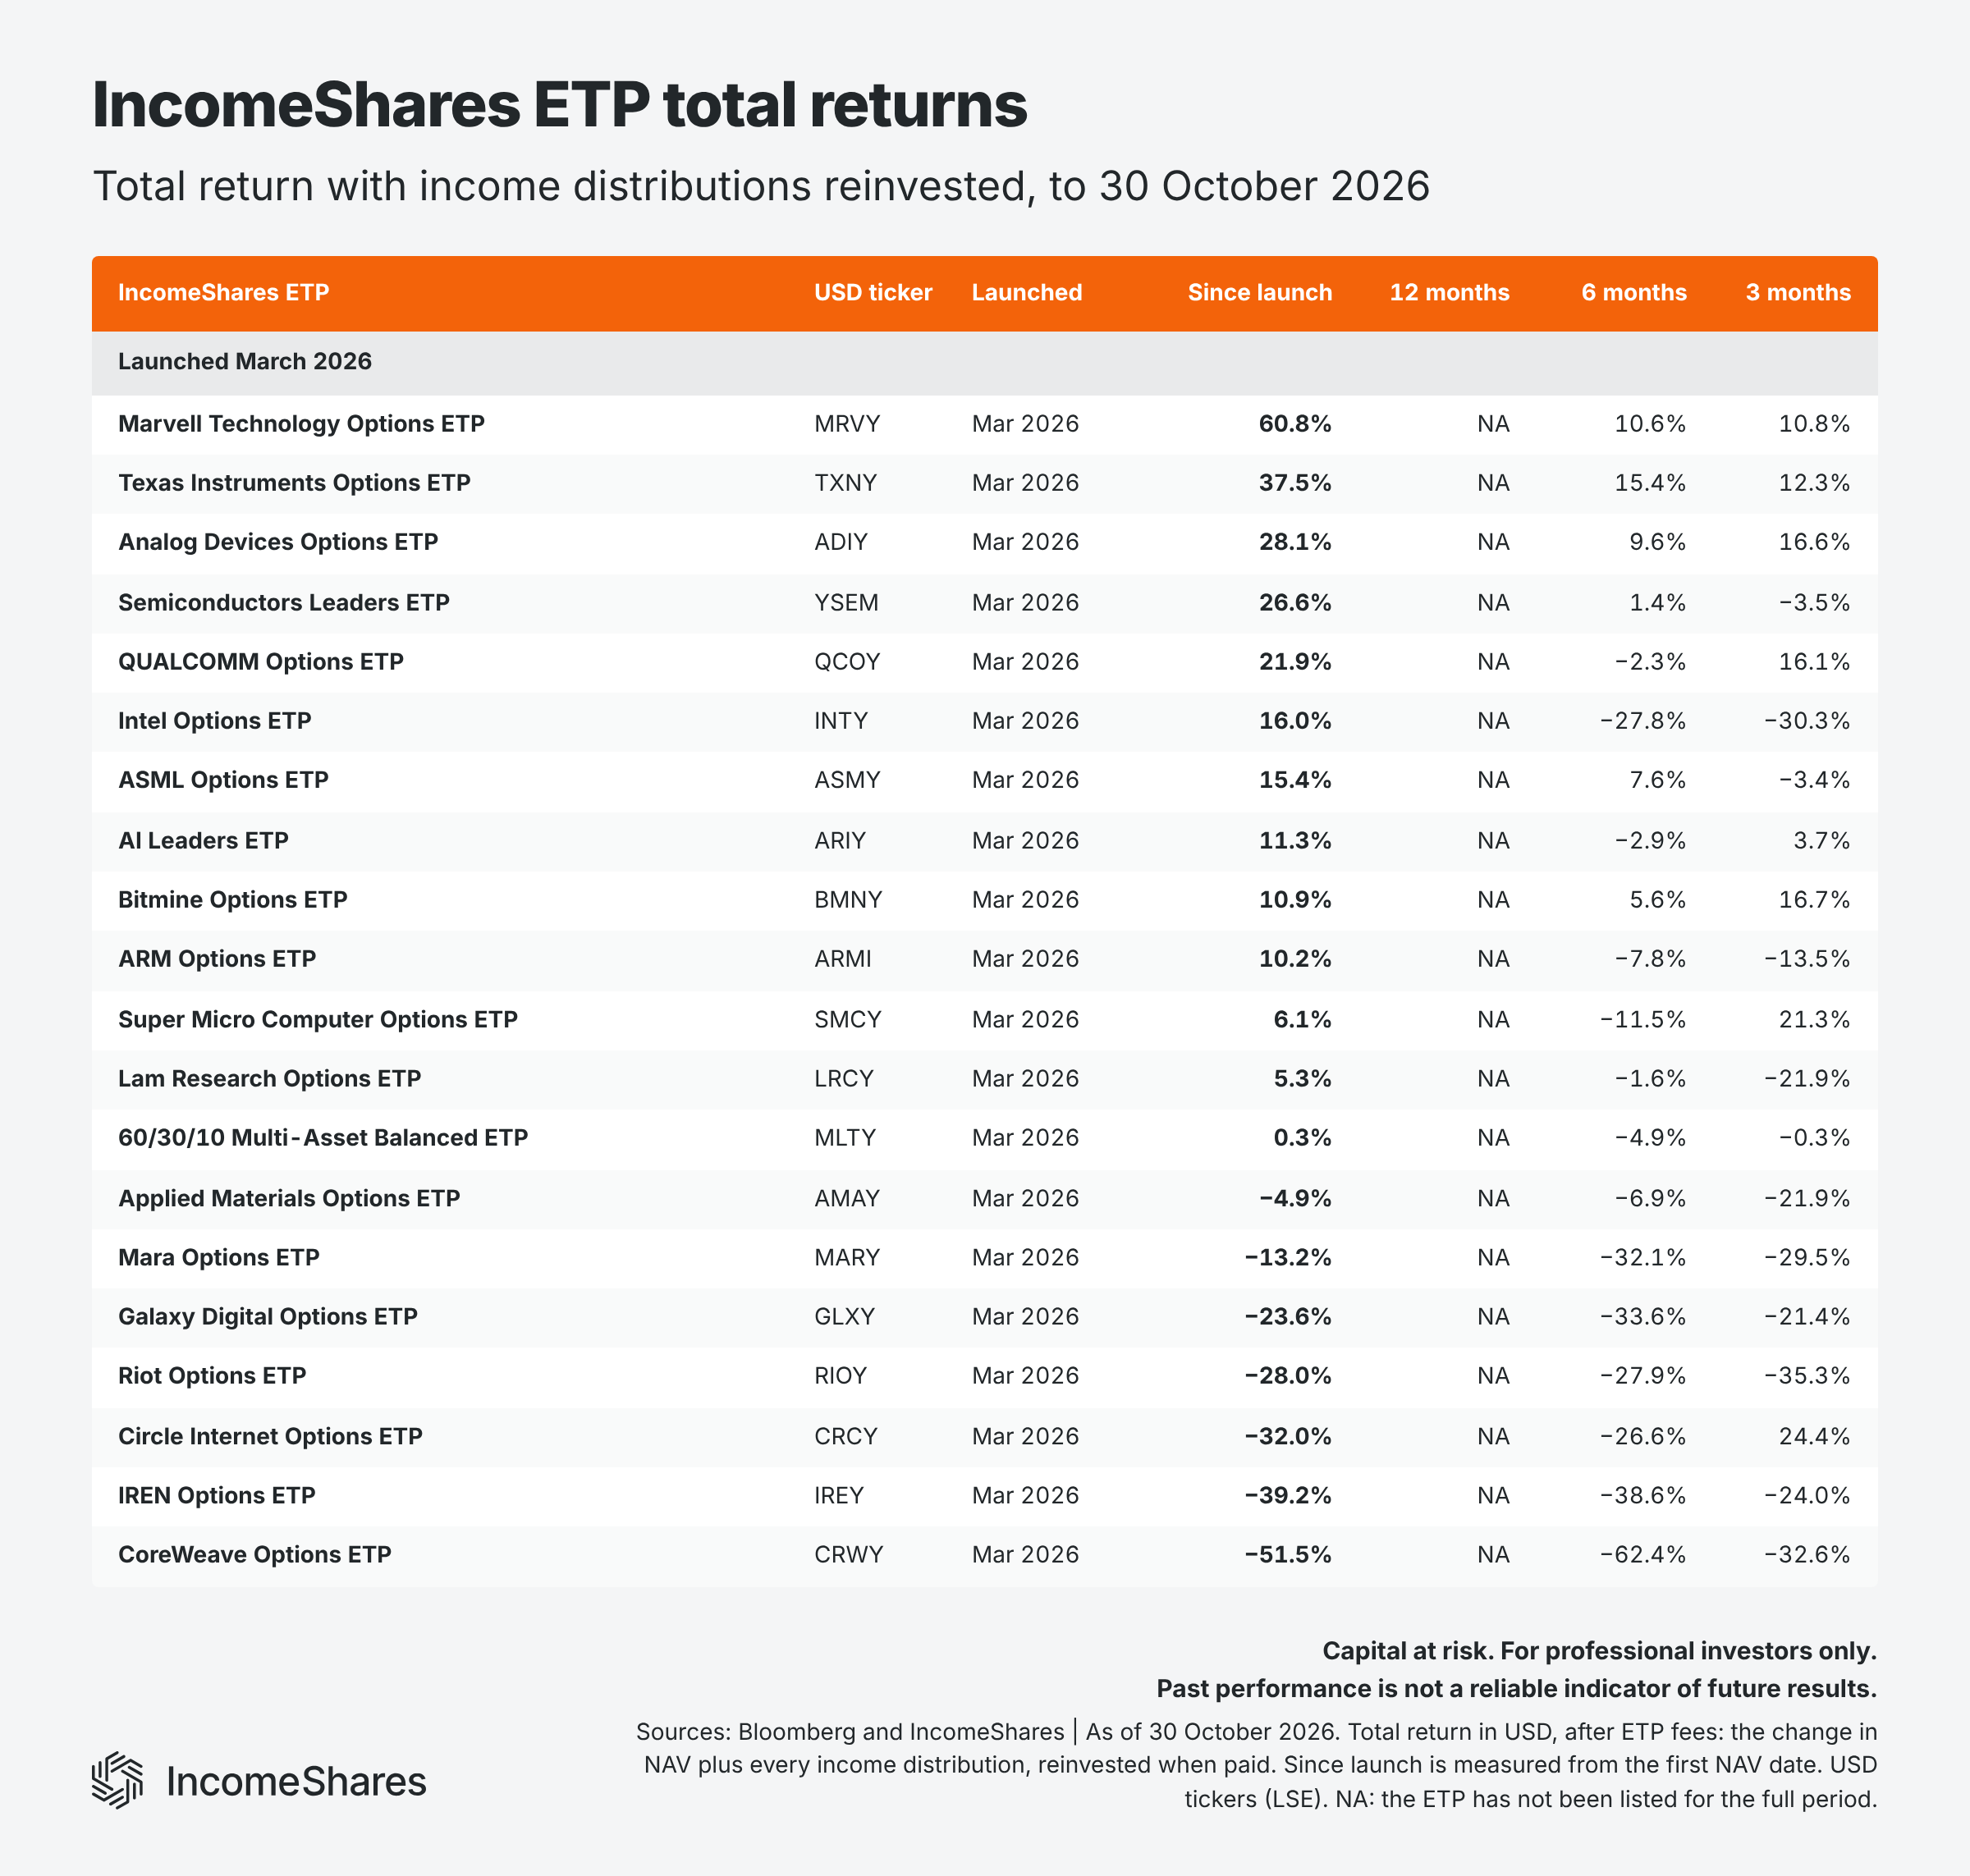
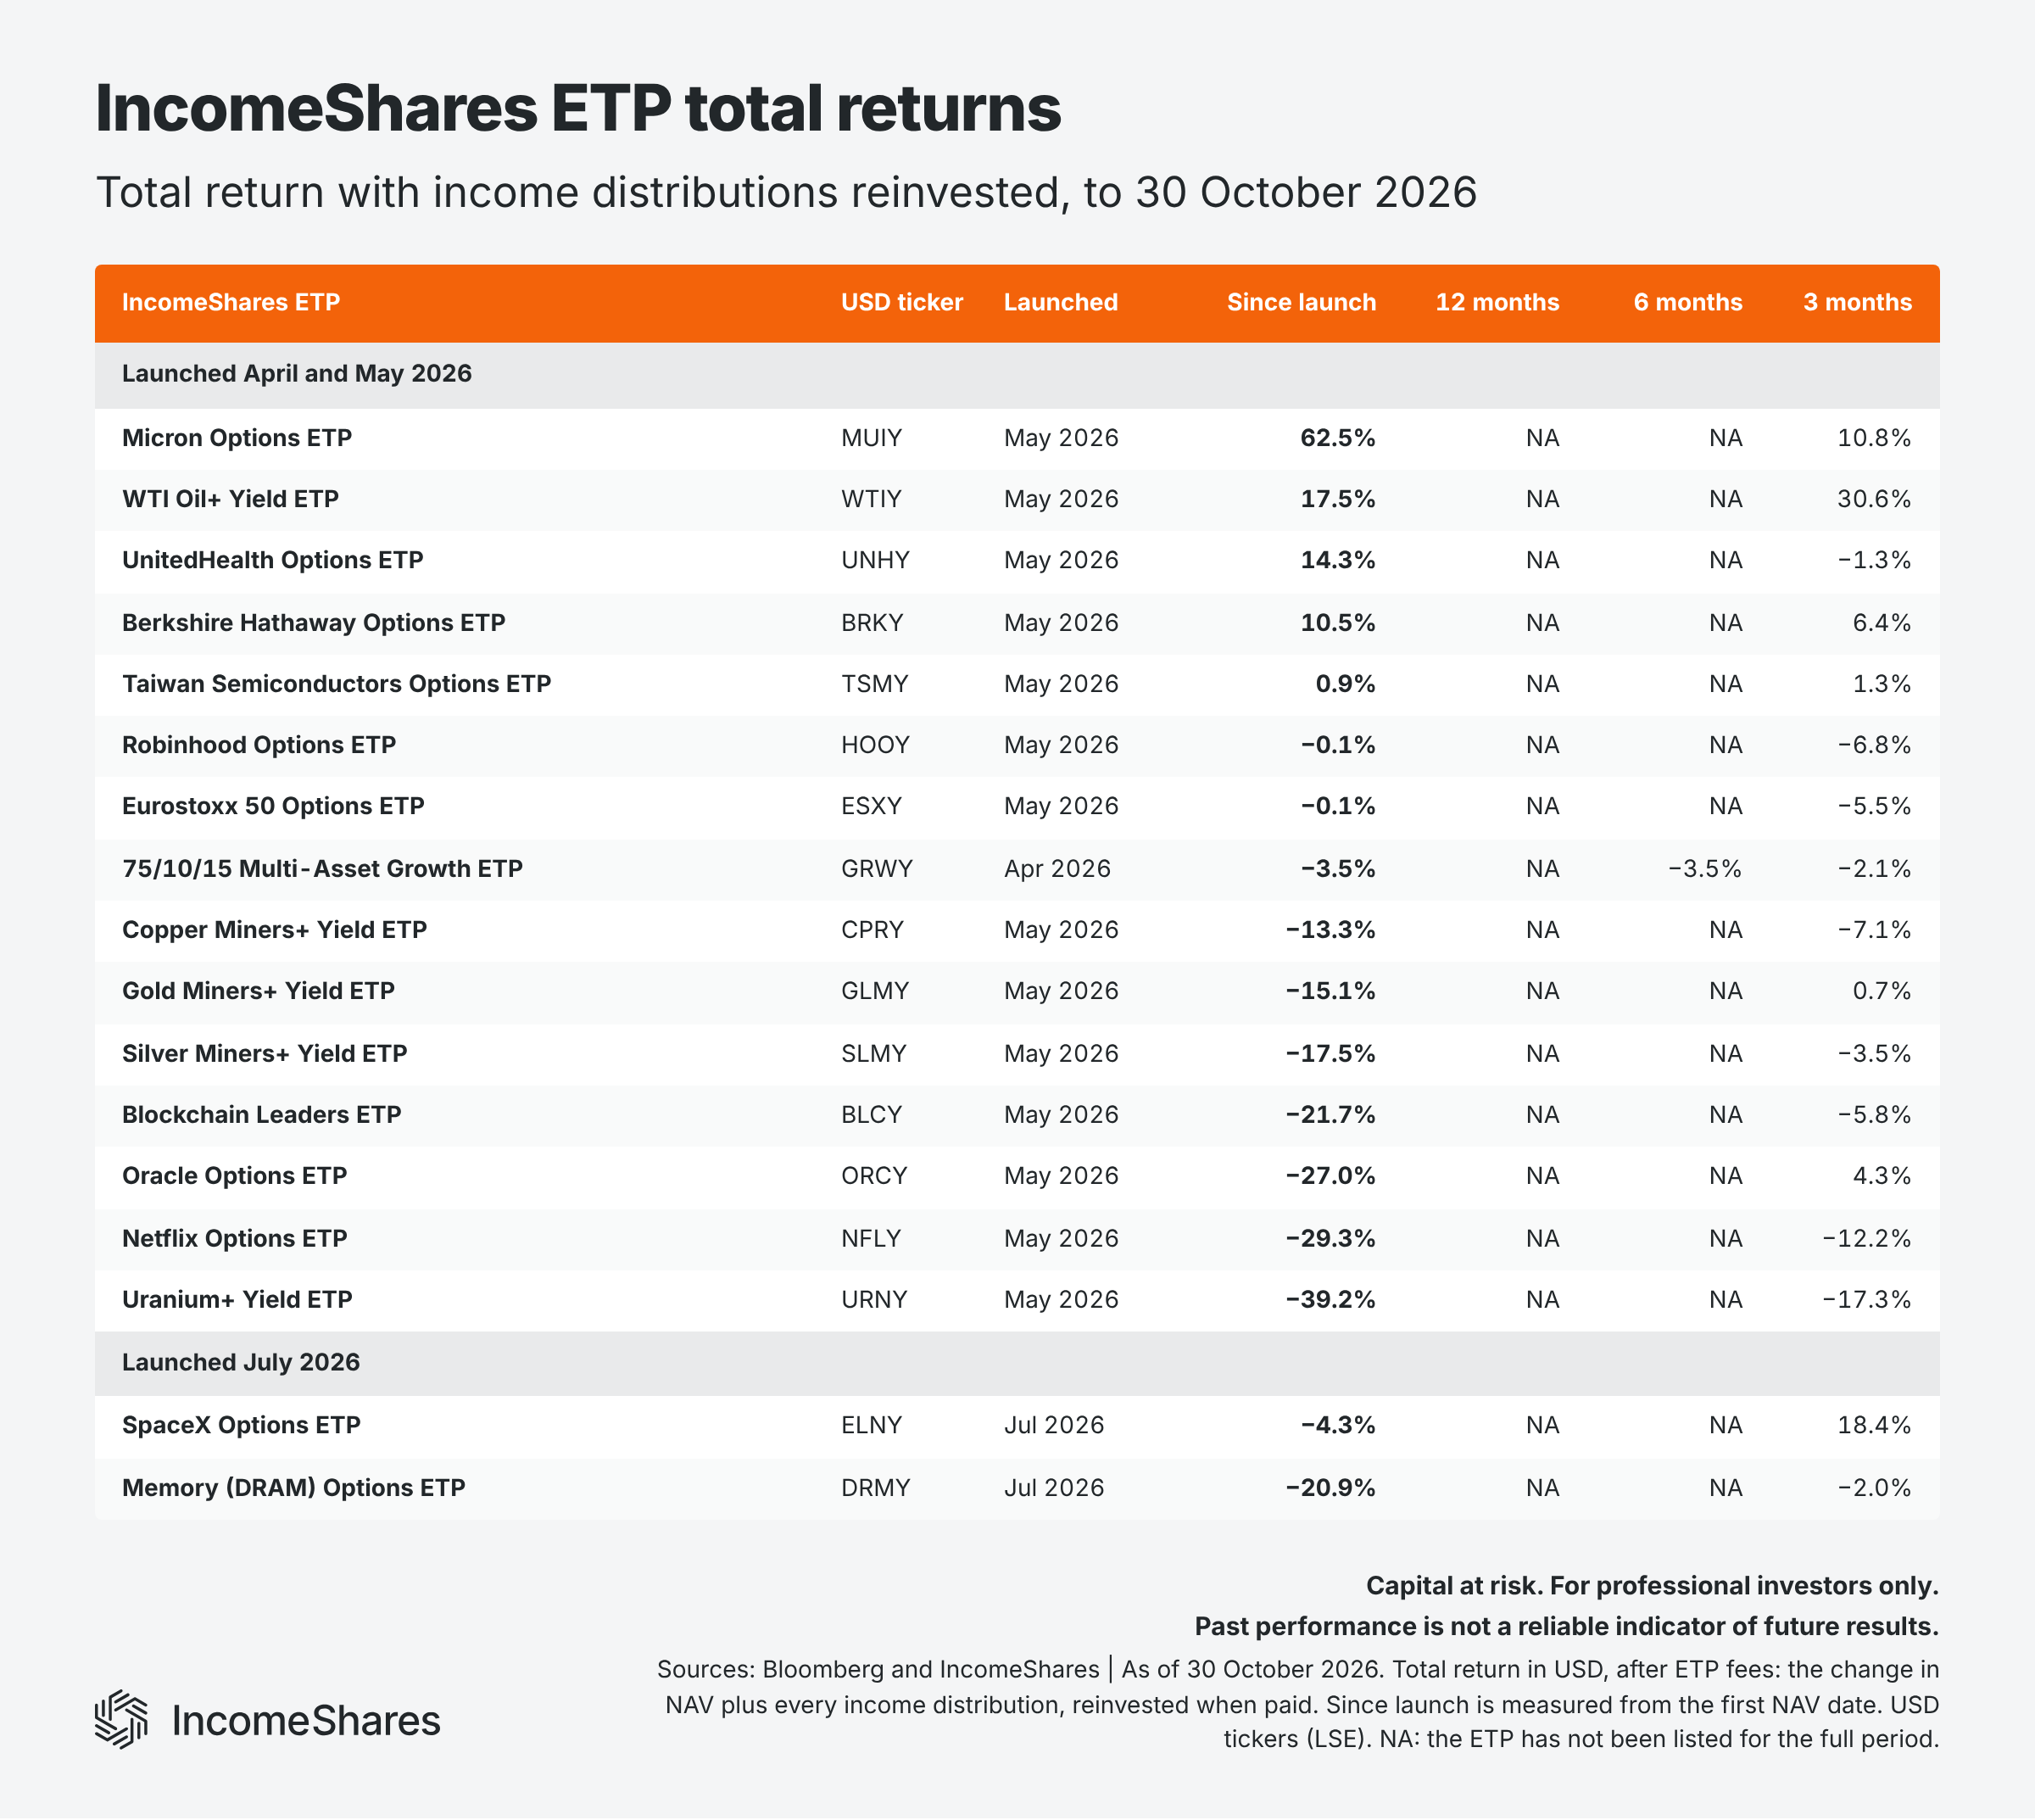
Distribution yields show the income IncomeShares ETPs pay, but not what an investor earned overall – that's what total return shows. It counts the change in an ETP's net asset value plus every income distribution, reinvested when it's paid.
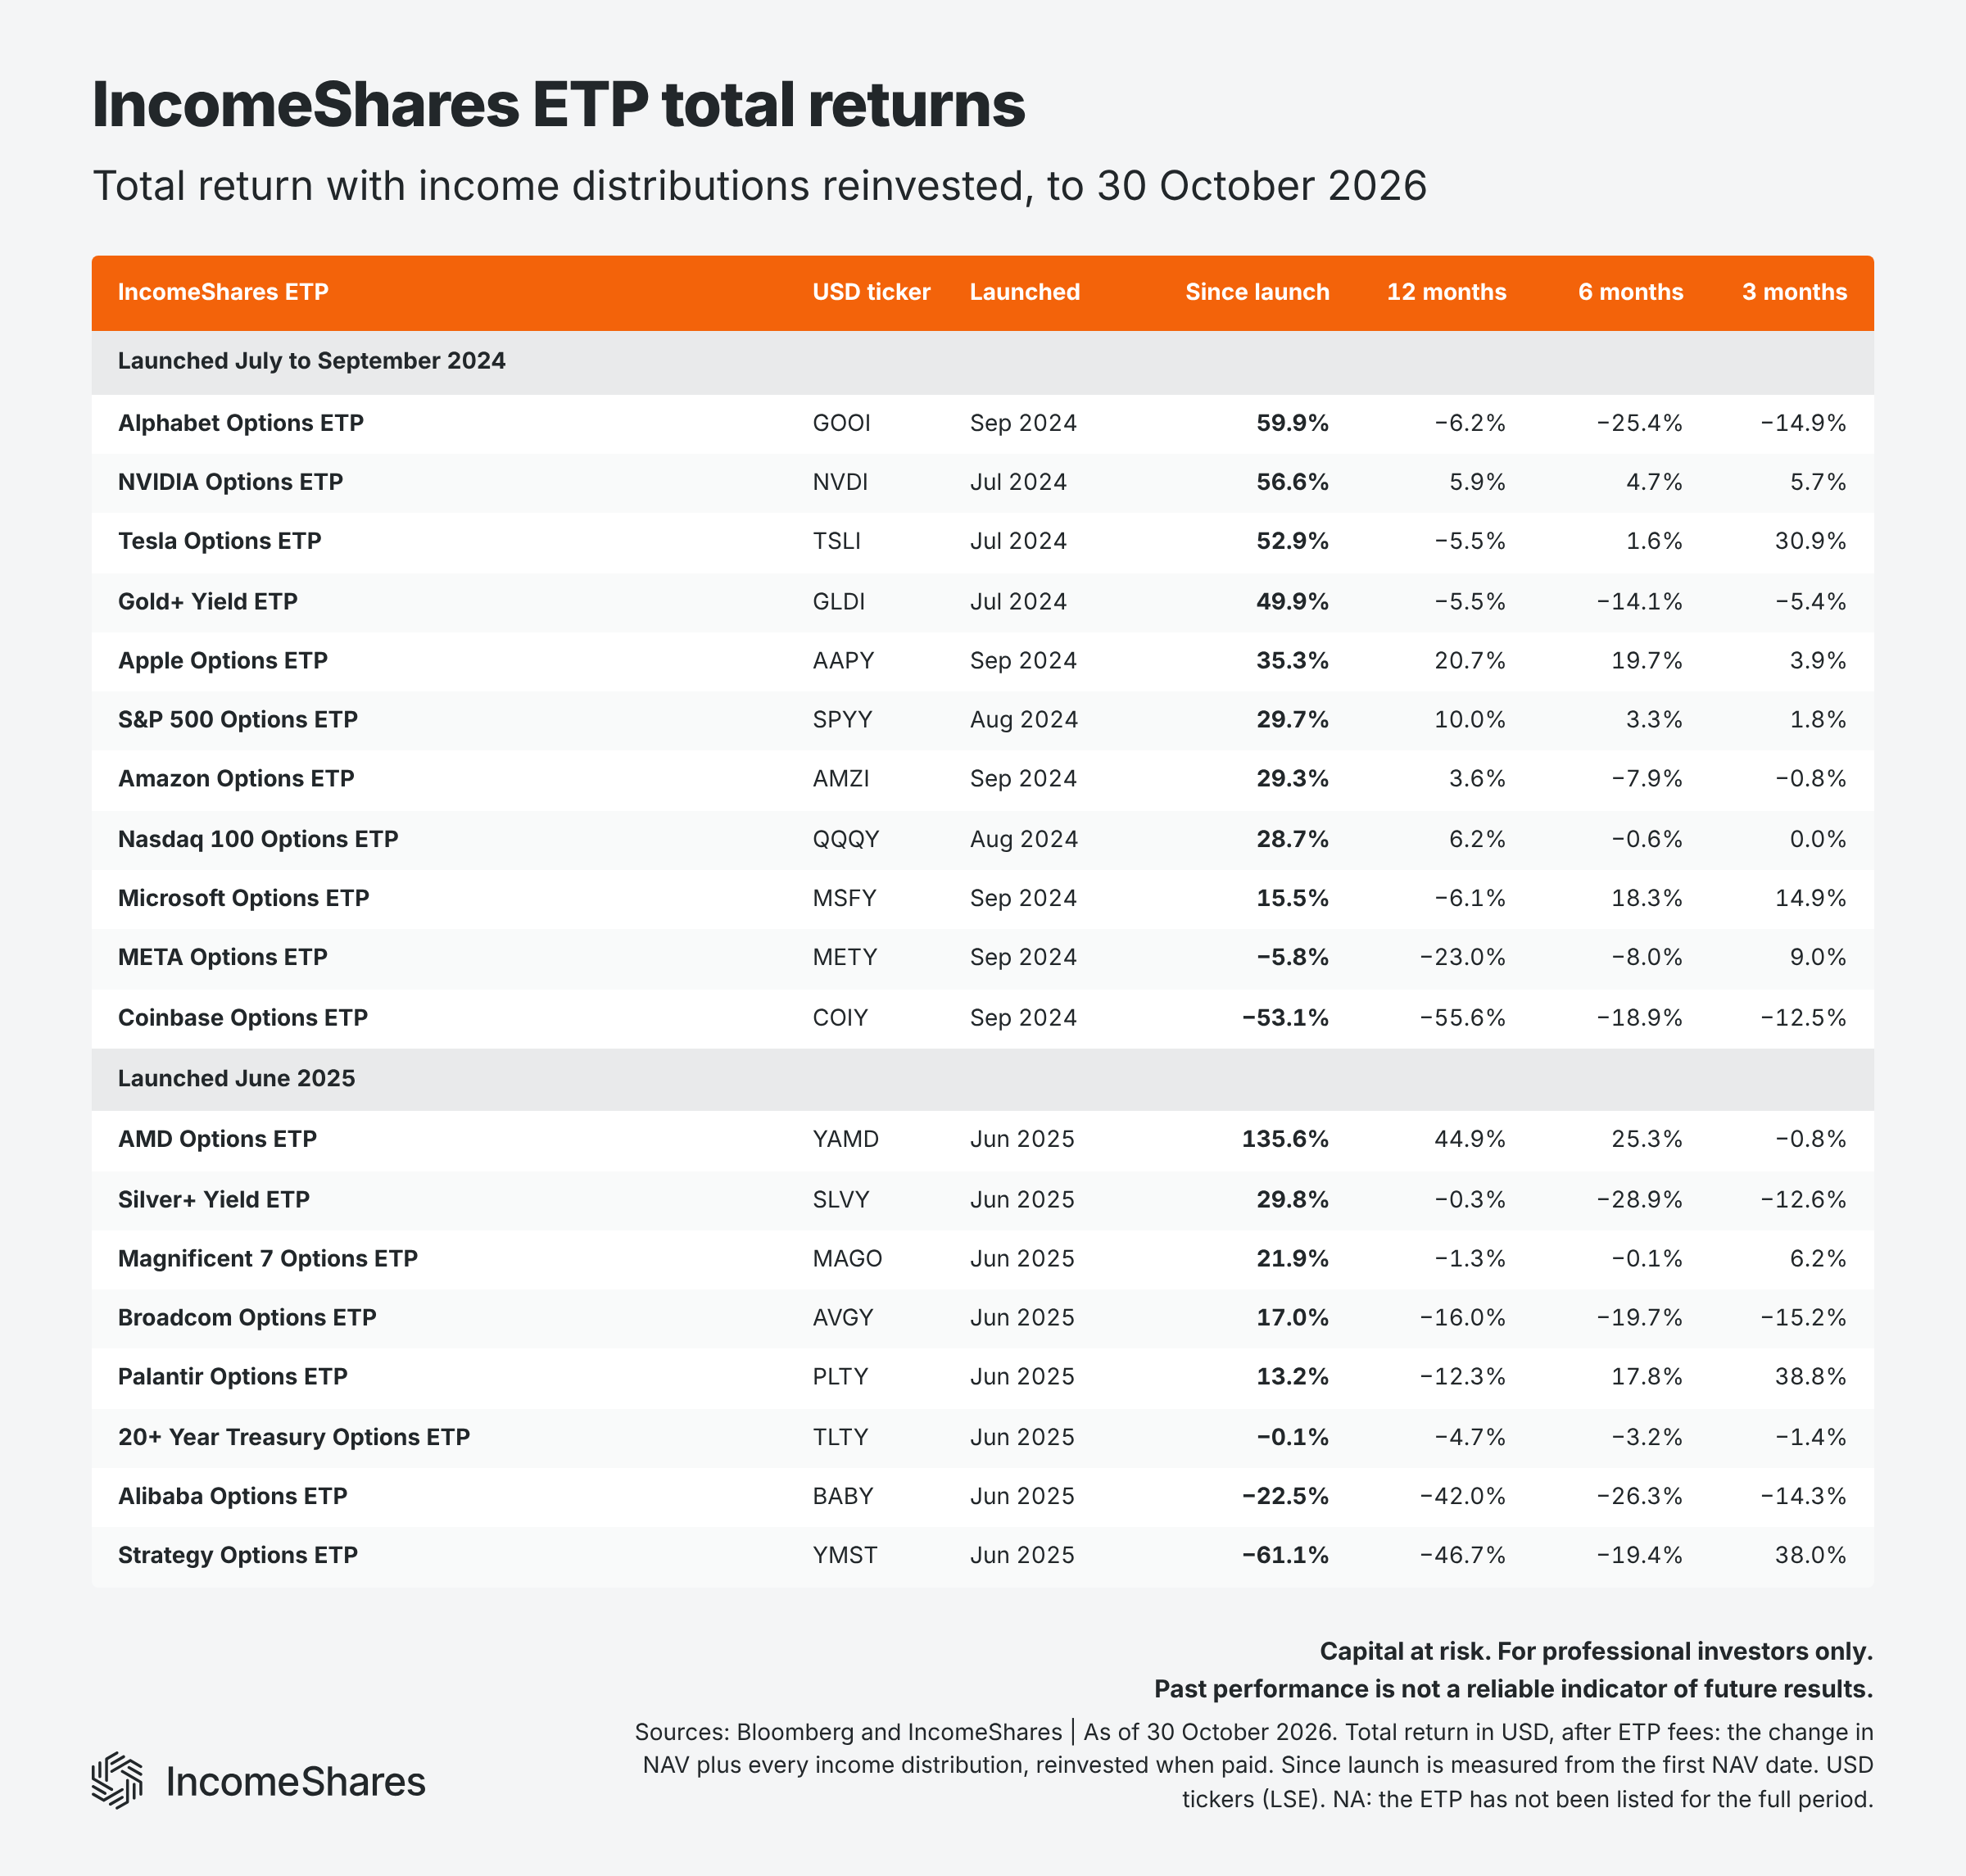
The tables below show total returns for all 56 ETPs to 30 October. They're based on each ETP's NAV, so they're after ETP fees. ETPs are grouped by launch date, so each block compares like with like. Within each block, they rank by return since launch. Of the 56 ETPs, 32 have a positive total return since launch and 24 a negative one.
Each ETP's total return depends largely on the underlying asset it holds, so returns vary widely across the range. Figures use daily NAV data from Bloomberg. Returns for ETPs launched this year cover a short period and can change quickly.
Key takeaways
Total AUM fell for the first time since July 2024, closing October at $208.8 million. Market moves cut about $17 million, as tech stocks and precious metals fell.
Cumulative fund flows reached $295.1 million on net inflows of $10.8 million. Gold+ Yield added $4.1 million.
Monthly turnover reached $53.5 million across exchanges. IREN, Mara, and Riot ETPs paid the highest distribution yields in October.
Your capital is at risk if you invest. You could lose all your investment. Please see the full risk warning here.
Related Products:

Strategy
Cash-Secured Put + Equity
Distribution Yield
51.86%

Strategy
Covered Call
Distribution Yield
11.91%

Strategy
Basket of Income-generating ETPs
Distribution Yield
38.87%

Strategy
Covered Call
Distribution Yield
11.99%

Strategy
Covered Call
Distribution Yield
11.87%

Strategy
Cash-Secured Put + Equity
Distribution Yield
113.47%

Strategy
Cash-Secured Put + Equity
Distribution Yield
67.54%

Strategy
Cash-Secured Put + Equity
Distribution Yield
157.34%

Strategy
Cash-Secured Put + Equity
Distribution Yield
127.90%

Strategy
Cash-Secured Put + Equity
Distribution Yield
59.19%